This text has been published in Spanish in 2019 as: Barros Guerton, J.; Ezquiaga Domínguez, JM. (2020). Los datos abiertos como herramienta de aproximación a los parámetros de la morfología urbana. Caso de estudio: densidades urbanas en la Comunidad de Madrid. En III Congreso Internacional ISUF-H. CIUDAD COMPACTA VS. CIUDAD DIFUSA. Editorial Universitat Politècnica de València. (20-05-2020):129-138. https://doi.org/10.4995/ISUFh2019.2019.9667
Some elements have been edited to take into account the blog format.
1. Introduction
This text is organized as an approach by successive scales to a question: How can urban density be described in the Community of Madrid? This question is part of a research route focused on the municipality of Madrid, for which the results represent a contribution that allows contextualizing the values.
The first answer to this question is posed in a comparison with three territories equally marked by metropolitan areas. The second answer, on a closer scale, results from comparing Madrid with other Spanish provinces in contrasting situations. And the third is an internal vision of the Madrid region itself, with greater detail in terms of morphological aspects, and also introducing the temporal dimension.
The methodology used is a series of parametric comparisons between different scales. To this end, it is taken into account that density data are generally reflected in terms of administrative units, because many of the phenomena, such as demographic or economic phenomena, are measured at that level; However, this approximation makes comparison very difficult when it comes to talking about a parameter such as building intensity, since the same urban form can correspond to very different densities if, for example, one part of the municipality is segregated or another is annexed. In an analysis along the lines of “compact city versus diffuse city” this becomes relevant, since the perimeters of administrative analysis can be very variable. For this reason, a large part of the calculations expressed have been made taking as a reference, from cadastral or similar data, the built footprint, and performing an “accordion operation”, which can be seen in image 1. This consists of creating an equidistance or buffer of 50 meters towards the outside of all the built footprints; to group these perimeters into a single one; and to make an equidistance of the same value, but inwards. This approach is based on the premise that, although the reflected built footprints have a presumption of accuracy, they may in some cases omit auxiliary constructions or underground parts, and may also omit paved areas. The polygons generated in this operation represent an envelope or footprint, which can be an approximation to a sealed surface that is more easily comparable between differentiated contexts.

Figure 1: Methodology for tracing the work footprint. From left to right: floor occupancy of the buildings according to cadastral cartography, buffer of 50 m to the outside, final result after buffer of 50 m to the inside. Own elaboration
2. Analysis
The first comparison puts the Madrid region on the same scale[1] [2] with New York City[3] (United States), the Île-de-France region[4] (France) and the Capital District of Bogotá[5] (Colombia). The choice of these cases is based on the availability of open data to address the issue, and having visited that space in person. In any case, the available data have diverse sources and methodologies, but they also refer to spaces that are not functionally equivalent. In the case of the Community of Madrid and the Ile-de-France, the space analysed covers the metropolitan area and outdoor spaces, as they are large-scale political delimitations; in the case of New York, the city is only the center of a large metropolitan area that encompasses three states, and in the case of Bogotá, the southward extension of the Capital District does not compensate for the intense functional relationship with Cundinamarca to the north and west. In the case of New York, the data outside the city and located for this text both within the state itself and in New Jersey and Connecticut have not allowed a broader area analysis, and in the case of Bogotá, the IGAC data for Cundinamarca on buildings on rural land, which are decisive for the study, are not complete.
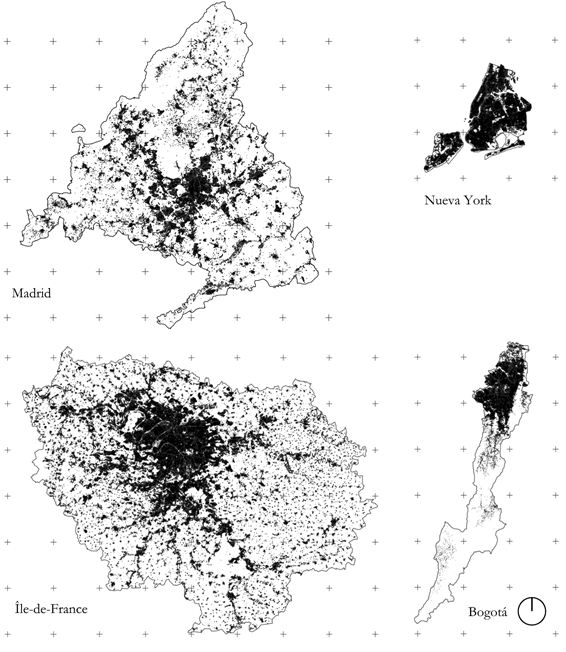
Figure 2: Areas of international comparison. The markings are spaced 20 km apart. Prepared by the author based on open data from the Spanish General Directorate of Cadastre, the Department of City Planning of New York City, the French Cadastre du Ministere de l’Action et des Comptes Publics, and the Spatial Data Infrastructure for the Capital District of Bogotá.
| Total C | C total/hab | C housing/room | Total C/m2 Political | Total C/m2 footprint | |
| Ile-de-France | 886.963.528 | 73 | 44,40 | 0,0738 | 0,5150 |
| New York | 508.383.979 | 61 | 38,32 | 0,6476 | 0,9970 |
| Bogota | 287.591.817 | 35 | 16,29 | 0,1758 | 1,0213 |
| Community of Madrid | 625.073.230 | 95 | 63,23 | 0,0778 | 0,9996 |
| Barcelona (Province) | 606.431.666 | 108 | 65,65 | 0,0702 | 0,8945 |
| Valencia (Province) | 407.072.990 | 160 | 93,75 | 0,0320 | 0,8488 |
| Coruña (Province) | 183.146.127 | 163 | 111,05 | 0,0230 | 0,5030 |
Table 1. Constructed areas (sum of all floors), expressed as “C”, total and related to housing, and their relationship with the volume of population, with the extension of the political-administrative area, and with the calculated footprint surfaces. Prepared by the author based on open data from the Spanish General Directorate of Cadastre, the Department of City Planning of New York City, the French Cadastre du Ministere de l’Action et des Comptes Publics and the Institut d’Urbanisme et d’Amenagement de la Région Île-de-France, and the Spatial Data Infrastructure for the Capital District of Bogotá.
The analysis of the data on built areas and densities comparing Madrid with the 3 international areas and the 3 Spanish provinces chosen shows that, if weighted with morphological criteria, the built footprint (which is approximated through the footprint described) has an almost equivalent density, in global terms, in the whole of Madrid and in the central areas of New York or Bogotá; This indicates a high compactness. The provinces of Valencia and Barcelona have somewhat lower values, but equally high. In contrast, the Île-de-France region and the province of A Coruña have values around half. In the first case, the density of central Paris is contrasted with a very important low-density single-family peri-urban extension, a situation that could also have a significant impact on the Colombian and American cases if New Jersey or Cundinamarca are included. In the case of A Coruña, the tradition of dispersed rural settlement plays an important role in this low figure, even with the very high built density of the capital municipality.
In terms of the total built area per inhabitant, the low value of Bogotá is striking, probably linked to a lower average per capita income. It seems intuitive that the average value of Île-de-France is higher than that of New York when it includes peri-urban spaces with lower land prices and construction. And it is striking that the Spanish provincial values are much higher; in the cases of Valencia and A Coruña a certain tradition of dispersion probably contributes to these values, but they are more than double the value of Paris. The analysis of these same data on provinces of what in recent years has been called empty Spain, corresponding to the inland territories that have experienced an intense process of depopulation during the twentieth century, and in which there are clearly no metropolitan phenomena, shows that the 300 m2 built per inhabitant can be exceeded (324 in Teruel, 281 in Cuenca), but that the density of the built footprint, which is an approximation of compactness, is at slightly higher values than those of the province of A Coruña (0.55 and 0.64, respectively).
In any case, it can be seen that the political-administrative limit, although it allows an interesting approximation in terms of estimating the degree of occupation of the same and the pressure exerted on the physical environment, does not allow a comparable reading of how the urban sprawl is organized.
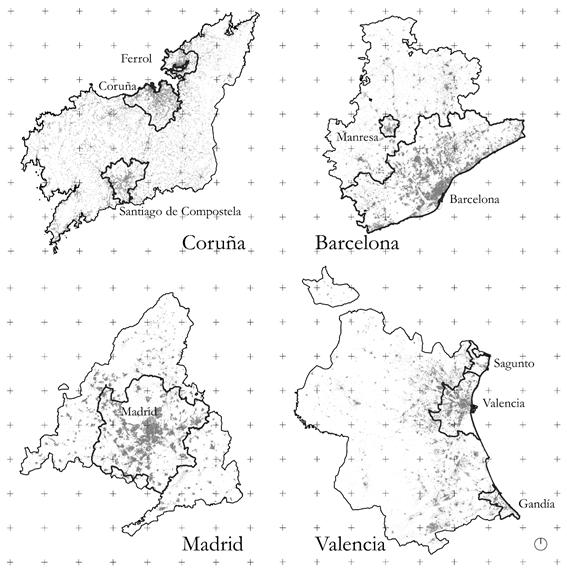
Figure 3. Areas of national comparison by provinces, with the delimitation of the Urban Areas defined by the Ministry of Public Works. The geographical positions of the provinces have been altered for ease of representation. The markings are spaced 20 km apart. Prepared by the author according to open data from the General Directorate of Cadastre
The analysis of the selected Spanish provinces taking into account the territorialised data by municipalities of the Personal Income Tax[6], which is indicative of the economy of the residents, but not of the activities, shows that the municipalities at the head of urban areas concentrate a higher disposable income and that the municipalities not attached to urban areas have lower disposable incomes on average. It can also be seen that as the built area per inhabitant increases, income tends to decrease, a trend that is verified not only by the aggregations indicated but also by municipalities. In other words, the mere fact of increasing the built stock of a municipality does not imply, per se, greater wealth for residents, but rather depends on the activities carried out by these inhabitants, inside or outside the municipality. Compared to €184 of disposable income per m2 built (S(Average disposable income x number of taxpayers)/S(total built area)) in the municipality of Barcelona, or €176 in Madrid, the average in municipalities not included in urban areas of the province of A Coruña is €38/m2, a value barely surpassed by the 41 of the municipalities with a small population in the urban area of Gandía. These data require, in any case, a subsequent contrast, not addressed here, to take into account the income generated by economic activities in each municipality, and especially in the case of municipalities with a strong presence of tourism.
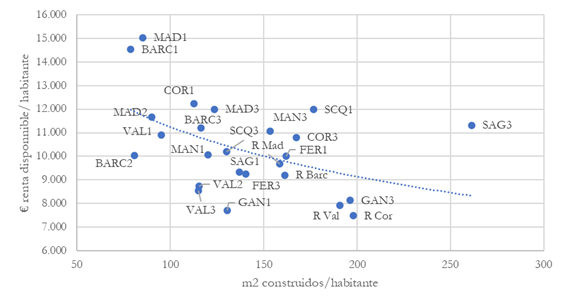
Figure 4. Ratio between m2 built per inhabitant according to the 2018 cadastre and disposable income per inhabitant in € according to 2016 Personal Income Tax data, by geographical areas, and regression curve. BARC: Barcelona, MAN: Manresa, COR: Coruña, FER: Ferrol, SCQ: Santiago de Compostela, MAD: Madrid, GAN: Gandía, SAG: Sagunto, VAL: Valencia. The suffix 1 indicates central municipality of the urban area, 2 municipality of the urban area with more than 50.00 inhabitants, 3 other municipalities of the urban area. The prefix R indicates other municipalities in the province not attached to the urban areas indicated. Own elaboration
The analysis by complete provinces, taking into account the built area, assigning each building its majority use according to six categories (residential, agricultural, industrial, offices, commerce and facilities), shows that, despite their differences, the built stock of these 4 provinces has similar characteristics, with around two thirds of the built area in buildings with majority residential use; it is clearly seen that the weight of agricultural elements is greater in Coruña, with more rural areas. The weight of offices (always in an exclusive building) is clearly more relevant in Madrid, where in the main municipality they represent 7% of the built area and in nine others this value is exceeded, while in Barcelona as a province it reaches 3.2%, with 5.8% in the capital and a higher value in 12 other municipalities. In any case, the analysis at the level of more disaggregated uses and below the scale of the building can introduce important nuances.
| Housing | Agriculture | Industry | Bureaux | Commerce | Equipment | |
| Community of Madrid | 66,9% | 2,5% | 9,5% | 5,2% | 4,0% | 11,9% |
| Barcelona (Province) | 68,4% | 2,5% | 14,2% | 3,2% | 3,8% | 7,8% |
| Valencia (Province) | 69,4% | 3,9% | 15,0% | 1,5% | 2,8% | 7,4% |
| Coruña (Province) | 70,3% | 6,2% | 10,0% | 1,3% | 3,0% | 9,2% |
Table 2. Distribution of the areas built in 2018 by predominant use of the building. Prepared by the author according to open data from the General Directorate of the Cadastre.
The most specific analysis at the level of the Community of Madrid involves delving into the conditions of the building from the level of the census section, the statistical unit with the highest level of detail in the Spanish statistical system. These sections are used for electoral and census purposes, with an average size of about 1,000 people; This means that its territorial extension is very variable, so it is not a unit that provides a satisfactory approximation in terms of density. The National Institute of Statistics publishes annual population data by census tract through the continuous register[7], and the Institute of Statistics of the Community of Madrid publishes, in the same area, data on employment and establishments. For this reason, it is proposed to apply the system of analysis by footprint through buffers in two directions already indicated, crossed with the delimitation of sections, obtaining what is called weighted sections, understanding that the activities are associated with the built areas; Given the low participation of the agricultural sector in Madrid’s economy and employment, this hypothesis seems reasonable.
In accordance with these premises and taking advantage of the fact that cadastral data allow the height of the buildings to be identified by built bodies, below the scale of the plot, an analysis is proposed in which the maximum numbers per weighted census section of above-ground and below-ground floors allow the spaces to be characterised according to morphological criteria. The following tables show the characterisation of the 4,345 census tracts of Madrid according to these two parameters[8], showing for each combination how the total buildable area and different population groups are distributed.
| No basement | 1 basement | 2 basements | 3 basements | More than 3 basements | |
| Ground floor (GF) | 0,00% | ||||
| GF+1 | 0,00% | 0,00% | |||
| GF+2 | 0,01% | 0,92% | 0,04% | ||
| GF+3 | 0,09% | 5,66% | 2,97% | 0,14% | |
| GF+4 | 0,17% | 4,67% | 5,41% | 0,88% | 0,10% |
| GF+5 | 0,15% | 4,10% | 5,12% | 2,45% | 0,70% |
| GF+6 | 0,14% | 2,03% | 4,56% | 2,07% | 0,90% |
| GF+7 | 0,08% | 1,46% | 2,64% | 2,54% | 1,58% |
| GF+8 | 0,11% | 1,08% | 3,19% | 2,98% | 1,64% |
| over 9 storeys | 0,74% | 4,37% | 7,80% | 9,94% | 16,56% |
Table 3. Percentage of total buildable area in the Community of Madrid by groups of weighted sections
| No basement | 1 basement | 2 basements | 3 basements | More than 3 basements | |
| Ground floor (GF) | 0,71 | ||||
| GF+1 | 0,60 | 0,62 | |||
| GF+2 | 0,55 | 0,32 | 0,54 | ||
| GF+3 | 1,03 | 0,37 | 0,37 | 0,39 | |
| GF+4 | 1,16 | 0,47 | 0,62 | 0,64 | 0,85 |
| GF+5 | 1,46 | 0,73 | 0,94 | 0,91 | 1,29 |
| GF+6 | 1,62 | 0,98 | 0,99 | 1,30 | 1,25 |
| GF+7 | 1,27 | 0,93 | 1,27 | 1,32 | 1,58 |
| GF+8 | 1,59 | 1,20 | 1,24 | 1,57 | 1,96 |
| over 9 storeys | 1,60 | 1,13 | 1,37 | 1,82 | 2,79 |
Table 4. Overall buildability coefficient for each group of weighted sections
| No basement | 1 basement | 2 basements | 3 basements | More than 3 basements | |
| GF | 2011 | ||||
| GF+1 | 1997 | 1961 | |||
| GF+2 | 1944 | 1984 | 1985 | ||
| GF+3 | 1975 | 1983 | 1988 | 1988 | |
| GF+4 | 1967 | 1980 | 1986 | 1980 | 1978 |
| GF+5 | 1968 | 1975 | 1983 | 1982 | 1986 |
| GF+6 | 1970 | 1975 | 1983 | 1981 | 1967 |
| Low+7 | 1970 | 1972 | 1977 | 1977 | 1964 |
| Low+8 | 1968 | 1970 | 1981 | 1974 | 1966 |
| over 9 storeys | 1974 | 1973 | 1975 | 1975 | 1968 |
Table 5. Average building age in weighted sections
| No basement | 1 basement | 2 basements | 3 basements | More than 3 basements | |
| GF | |||||
| GF+1 | 0,00% | 0,00% | |||
| GF+2 | 0,00% | 0,34% | 0,01% | ||
| GF+3 | 0,04% | 2,46% | 1,60% | 0,15% | |
| GF+4 | 0,12% | 2,07% | 3,76% | 0,88% | 0,09% |
| GF+5 | 0,05% | 2,65% | 3,29% | 2,56% | 1,12% |
| GF+6 | 0,06% | 1,64% | 2,96% | 2,11% | 2,00% |
| GF+7 | 0,04% | 1,25% | 2,13% | 2,60% | 2,95% |
| GF+8 | 0,09% | 0,83% | 3,06% | 2,56% | 3,11% |
| over 9 storeys | 0,39% | 3,14% | 6,98% | 13,88% | 27,04% |
Table 6. Percentage of employed by group of weighted sections
| No basement | 1 basement | 2 basements | 3 basements | More than 3 basements | |
| GF | 0,02% | ||||
| GF+1 | 0,05% | 0,01% | 0,00% | ||
| GF+2 | 0,02% | 0,69% | 0,04% | ||
| GF+3 | 0,25% | 4,22% | 2,32% | 0,11% | |
| GF+4 | 0,44% | 5,10% | 4,71% | 0,77% | 0,12% |
| GF+5 | 0,36% | 5,71% | 6,47% | 2,19% | 0,54% |
| GF+6 | 0,35% | 2,97% | 5,13% | 2,34% | 0,56% |
| GF+7 | 0,19% | 1,66% | 2,98% | 2,26% | 1,16% |
| GF+8 | 0,26% | 1,84% | 3,38% | 2,74% | 1,12% |
| over 9 storeys | 1,63% | 7,29% | 9,90% | 10,47% | 7,65% |
Table 7. Percentage of inhabitants by weighted section groups
| No basement | 1 basement | 2 basements | 3 basements | More than 3 basements | |
| GF | 0,06% | ||||
| GF+1 | 0,15% | 0,01% | 0,00% | ||
| GF+2 | 0,01% | 0,50% | 0,03% | ||
| GF+3 | 0,21% | 4,03% | 2,41% | 0,09% | |
| GF+4 | 0,41% | 4,90% | 5,54% | 0,71% | 0,11% |
| GF+5 | 0,30% | 5,25% | 7,08% | 2,52% | 0,68% |
| GF+6 | 0,33% | 2,78% | 6,04% | 2,72% | 0,57% |
| GF+7 | 0,18% | 1,61% | 3,47% | 3,27% | 1,11% |
| GF+8 | 0,21% | 1,51% | 3,70% | 3,45% | 1,14% |
| over 9 storeys | 1,33% | 5,76% | 8,74% | 9,99% | 7,12% |
Table 8. Percentage of children under 5 years of age by weighted section groupsa
| No basement | 1 basement | 2 basements | 3 basements | More than 3 basements | |
| GF | 0,00% | ||||
| GF+1 | 0,00% | 0,01% | 0,00% | ||
| GF+2 | 0,03% | 0,64% | 0,04% | ||
| GF+3 | 0,24% | 3,47% | 1,77% | 0,09% | |
| GF+4 | 0,56% | 4,62% | 3,52% | 0,78% | 0,13% |
| GF+5 | 0,46% | 5,69% | 5,36% | 2,08% | 0,48% |
| GF+6 | 0,38% | 2,75% | 4,03% | 1,94% | 0,58% |
| GF+7 | 0,25% | 1,66% | 2,25% | 1,68% | 1,15% |
| GF+8 | 0,36% | 2,30% | 2,79% | 2,21% | 1,12% |
| over 9 storeys | 2,15% | 9,49% | 11,23% | 12,52% | 9,18% |
Table 9. Percentage of people over 65 years of age by weighted section groups
The figures show that, for example, 48% of the built area in the Community of Madrid is in census tracts in which there is at least one low-rise building plus eight or more storeys (table 3), in which the buildability coefficients are generally above 1.1 m2/m2 (table 4). where the average age of the building is about 40 years (Table 5); 61% of employed people in the region work in these areas (Table 6), where 46% of the inhabitants live (Table 7), 43% of those under 5 years of age (Table 8) and 53% of those over 65. (Table 9) If the variable of basements is introduced, in the 352 areas with at least one building with more than 9 floors and more than 3 basements there is 16.6% of the built area, the average buildable area exceeds 2.79 m2/m2, the average age of the building is 50 years and 27% of the employed work; Only 7.65% of Madrid residents, 7.12% of those under 5 years of age and 9.18% of those over 65 live.
In an analysis by municipalities, and restricting the analysis to those of Madrid due to their size, those of Pozuelo de Alarcón and Boadilla del Monte as the two in the region with the highest income declared in the Personal Income Tax in 2016, and Alcalá de Henares and Fuenlabrada representing large municipalities in population with lower personal incomes. Important differences between municipalities can be seen, revealing both physical and socioeconomic differences. In municipalities with higher incomes, most of the population, in general and more pronounced for those over 65, live in sections with moderate heights, while in those with lower incomes a very high proportion lives in areas with higher altitudes. The types of spaces with the highest use are also clearly different.
| GF+1 | GF+2 | GF+3 | GF+4 | GF+5 | GF+6 | GF+7 | GF+8 | >GF+8 | |
| Madrid | 0,0% | 0,0% | 0,5% | 2,1% | 6,4% | 8,1% | 9,3% | 13,0% | 60,5% |
| Alcalá | 0,7% | 2,8% | 4,2% | 8,3% | 13,1% | 9,5% | 22,1% | 39,3% | |
| Pozuelo | 30,4% | 30,9% | 29,0% | 7,0% | 2,6% | ||||
| Boadilla | 5,9% | 24,8% | 23,8% | 37,9% | 7,7% | ||||
| Fuenlabrada | 2,0% | 5,8% | 2,6% | 17,6% | 4,6% | 67,3% |
Table 10. Percentage of built-up area in 5 municipalities, by grouping of weighted sections, according to their maximum height
| GF+1 | GF+2 | GF+3 | GF+4 | GF+5 | GF+6 | GF+7 | GF+8 | >GF+8 | |
| Madrid | 0,0% | 0,1% | 0,5% | 2,4% | 7,2% | 9,7% | 9,8% | 12,9% | 57,4% |
| Alcalá | 0,9% | 4,1% | 5,9% | 10,3% | 10,4% | 6,4% | 21,5% | 40,6% | |
| Pozuelo | 35,4% | 31,4% | 28,0% | 2,6% | 2,6% | ||||
| Boadilla | 7,5% | 31,6% | 26,0% | 27,0% | 7,9% | ||||
| Fuenlabrada | 1,5% | 8,7% | 2,9% | 2,0% | 5,5% | 79,3% |
Table 11. Percentage of built-up area in buildings with a majority residential use in 5 municipalities, by grouping of weighted sections, according to their maximum height
| GF+1 | GF+2 | GF+3 | GF+4 | GF+5 | GF+6 | GF+7 | GF+8 | >GF+8 | |
| Madrid | 0,0% | 0,1% | 0,4% | 2,8% | 9,0% | 10,7% | 10,2% | 12,8% | 54,0% |
| Alcalá | 0,5% | 4,3% | 5,4% | 7,6% | 9,4% | 6,5% | 19,3% | 46,9% | |
| Pozuelo | 31,3% | 26,4% | 36,5% | 3,0% | 2,9% | ||||
| Boadilla | 5,2% | 21,5% | 25,4% | 35,6% | 12,4% | ||||
| Fuenlabrada | 1,5% | 8,0% | 2,0% | 1,5% | 4,9% | 82,1% |
Table 12. Percentage of dwellings in 5 municipalities, by grouping of weighted sections, according to their maximum height
| GF+1 | GF+2 | GF+3 | GF+4 | GF+5 | GF+6 | GF+7 | GF+8 | >GF+8 | |
| Madrid | 0,0% | 0,1% | 0,6% | 3,0% | 9,5% | 11,0% | 10,0% | 12,7% | 53,0% |
| Alcalá | 2,5% | 1,2% | 2,5% | 5,8% | 14,3% | 10,0% | 21,8% | 42,0% | |
| Pozuelo | 32,3% | 26,8% | 35,2% | 2,7% | 3,0% | ||||
| Boadilla | 4,8% | 22,1% | 26,1% | 34,9% | 12,1% | ||||
| Fuenlabrada | 2,0% | 7,5% | 1,8% | 2,0% | 4,8% | 81,9% |
Table 13. Percentage of inhabitants in 5 municipalities, by grouping of weighted sections, according to their maximum height
| GF+1 | GF+2 | GF+3 | GF+4 | GF+5 | GF+6 | GF+7 | GF+8 | >GF+8 | |
| Madrid | 0,0% | 0,1% | 0,4% | 3,1% | 9,3% | 9,4% | 8,3% | 10,6% | 58,8% |
| Alcalá | 0,4% | 4,7% | 6,5% | 3,8% | 7,1% | 6,6% | 18,8% | 52,1% | |
| Pozuelo | 40,9% | 24,0% | 31,0% | 1,1% | 3,1% | ||||
| Boadilla | 7,5% | 31,4% | 26,1% | 24,5% | 10,5% | ||||
| Fuenlabrada | 1,6% | 10,7% | 1,6% | 1,3% | 5,2% | 79,6% |
Table 14. Percentage of inhabitants over 65 years of age in 5 municipalities, by grouping of weighted sections, according to their maximum height
| GF+1 | GF+2 | GF+3 | GF+4 | GF+5 | GF+6 | GF+7 | GF+8 | >GF+8 | |
| Madrid | 0,0% | 0,0% | 0,2% | 0,9% | 4,1% | 5,1% | 8,2% | 11,3% | 70,1% |
| Alcalá | 0,7% | 2,8% | 4,2% | 8,3% | 13,1% | 9,5% | 22,1% | 39,3% | |
| Pozuelo | 16,7% | 41,1% | 32,4% | 8,6% | 1,2% | ||||
| Boadilla | 2,7% | 21,0% | 19,2% | 47,7% | 9,3% | ||||
| Fuenlabrada | 2,0% | 5,8% | 2,6% | 17,6% | 4,6% | 67,3% |
Table 15. Percentage of employed people in 5 municipalities, by grouping of weighted sections, according to their maximum height
| GF | GF+1 | GF+2 | GF+3 | GF+4 | GF+5 | GF+6 | GF+7 | GF+8 | |
| Madrid | 0,0% | 0,0% | 0,4% | 1,1% | 5,0% | 5,4% | 15,1% | 10,8% | |
| Alcalá | 0,4% | 0,0% | 0,7% | 14,0% | 4,4% | 6,0% | 25,5% | ||
| Pozuelo | 20,3% | 25,0% | 20,0% | 33,0% | |||||
| Boadilla | 0,0% | 10,0% | 37,4% | 42,4% | 10,2% | ||||
| Fuenlabrada | 17,1% | 1,2% | 1,0% | 30,8% | 0,8% |
Comparing height with the builtarea by height of built bodies, it should be noted, for example, that in Madrid 60.5% of the built area is in sections where there is at least one built body of 8 or more floors (table 10), but that these bodies, over the city as a whole, only add up to 10.8% of the built area (table 17).
| GF | GF+1 | GF+2 | GF+3 | GF+4 | GF+5 | GF+6 | GF+7 | GF+8 | >GF+8 | |
| Madrid | 29,3% | 4,5% | 5,4% | 7,9% | 12,6% | 8,9% | 8,2% | 7,6% | 4,7% | 10,8% |
| Alcalá | 41,1% | 10,4% | 8,3% | 7,4% | 7,9% | 5,5% | 4,8% | 5,9% | 2,3% | 6,4% |
| Pozuelo | 39,2% | 18,4% | 17,3% | 19,7% | 5,1% | 0,3% | 0,1% | 0,0% | 0,0% | 0,0% |
| Boadilla | 47,4% | 20,4% | 14,2% | 10,2% | 7,0% | 0,5% | 0,2% | 0,0% | 0,0% | 0,0% |
| Fuenlabrada | 36,1% | 9,5% | 4,9% | 5,0% | 8,8% | 4,2% | 3,7% | 6,8% | 5,0% | 16,1% |
Table 17. Percentage of total built-up area in each municipality, by height of the built-up bodies
Finally, the cadastral information system includes regular updates. The data published in 2014 at a global level for all the provinces managed by the Ministry of Finance[9] showed a total of 580.8 million m2 built for the Community of Madrid; the data for 2018, according to the work carried out for this writing, would be 624.8 million, and the exploitation of the data published in April 2019 yields a value of 630.6 million. The detailed analysis of these figures shows that they are modified both by demolitions and new constructions and by corrections of transcription errors[10], which despite the high level of quality of the cadastral base are present in a small number.
3. Conclusions
The international and national comparison shows that the Community of Madrid has a relatively compact footprint, although with significant internal variations in its building intensity and uses. The open data used have made it possible to carry out an initial characterisation of the footprint of the Community of Madrid as a whole, and the methodology allows this analysis to be taken to a much more detailed level, of census section. The continuity of the research will allow an adjustment of the parameters to support management decision-making.
The use of sources from different sources has shown the relevance of taking into account the specific production conditions of each one, which means that the comparison can only be made on very limited parameters, such as the built area or heights. It is certainly impossible, even within Spain, to make precise calculations of the computable urban area, given that although the cadastral methodology is presented as homogeneous, in practice each delegation introduces certain biases, and also its purpose is fiscal, so it measures only what is taxed; On the other hand, each municipality has its own criteria for measuring the computable area, which makes the work on a large group particularly complicated. This does not detract from the interest of the analysis, even at the urban level, since the cadastral source is the most detailed; In the field of territorial planning, this cross-sectional comparison is even more interesting, since on this scale the relationships and balances between variables are often more relevant than absolute values.
The crossing of socioeconomic values allows an important weighting of physical morphological parameters; The discrepancies between data dates of one type and the other are relatively cushioned by the much greater inertia, at least at the present time, of the built stock with respect to socioeconomic phenomena.
References:
Mercadé Aloy, J., Magrinya Torner, F, Cervera Alonso de Medina, M. 2018. “Descifrando la forma urbana. Un análisis de patrones de agrupamiento basado en SIG.”. GeoFocus (Artículos), nº 22, P3-19. ISSN: 1578-5157. http:dx.doi.org/10.21138/GF.612
Fusco, Giovanni y Araldi, Alessandro. 2017. “The Nine Forms of the French Riviera: Classifying Urban Fabrics from the Pedestrian Perspective”. En 24th ISUF International Conference. Book of Papers. Editorial Universitat Politècnica de València. 1313-1325. doi:10.4995/ISUF2017.2017.5219
Cordeau, Erwan. 2016. Les îlots morphologiques urbains (IMU). Délimitation et caractérisation des « IMU 2012 » en Île-de-France. Institut d’Amenagement et d’Urbanisme d’Île-de-France. https://www.iau-idf.fr/nos-travaux/publications/les-ilots-morphologiques-urbains-imu.html
AAVV. 2016. Future of Cities: The Science of Cities and Future Research Priorities. A report by the project’s Lead Expert Group. Foresight, Government Office for Science
Angel, S. 2015. The rise and fall of Manhattan’s densities, 1800-2010. Marron Institute of Urban Management. NYU. https://marroninstitute.nyu.edu/uploads/content/Manhattan_Densities_High_Res,_1_January_2015.pdf
García Martín, Fernando Miguel. 2014. “Estudios de Forma Urbana en la Región de Murcia. Densidad y Compacidad del casco urbano de Lorca”. In VII Anuario de jóvenes Investigadores. Universidad Politécnica de Cartagena
Dirección General de Arquitectura, Vivienda y Suelo .2014. “Boletín Especial Censo 2011 Parque edificatorio”. Observatorio de Vivienda y Suelo. Ministerio de Fomento, Madrid, Abril 2014.
Batty, Michael. 2013. The New Science of Cities. The MIT Press.
AA VV .2013. “Policentrismo en los espacios urbanos. Aglomeraciones urbanas con varios centros/polos históricos. ¿Qué está pasando en España?”. Número Especial de Ciudad y Territorio. Vol XLV. Cuarta época. Nº 176. Verano 2013.
Ezquiaga Domíngez, José María, Barros Guerton, Javier, y Peribañez Ayala, Gemma. 2013. “La rehabilitación como sector de futuro en Madrid”. Barómetro de Economía de la Ciudad de Madrid, nº 35, 1er trimestre 2013. https://www.madrid.es/UnidadesDescentralizadas/UDCObservEconomico/BarometroEconomia/2013/Ficheros/Enero/rehabilitacion.pdf
Sevtsuk, A., y Mekonnen, M. 2012. “Urban Network Analysis”. A new toolbox for ArcGIS. Revue Internationale de Géomatique. http://doi.org/10.3166/rig.22.287-305
Gallo, M.T.; Garrido, R.. 2012. “Una aproximación a la estructura urbana policéntrica en la Comunidad de Madrid”. ACE: Architecture, City and Environment, 6 (18), pp 69-100
Temes Cordovez, Rafael. 2008. “Las fuentes catastrales y la identificación de las transformaciones en los tejidos urbanos”. CT: Catastro, nº 64, Madrid, pp 55-78. Doi: http://hdl.handle.net/10251/11114
De Sola Morales, Manuel. 1993. Las formas del crecimiento urbano. Barcelona: Edició UPC (Col. D’Arquitectura)
Alexander, C, Ishikawa, S., y Silverstein, M. 1977. A Pattern Language. http://doi.org/10.2307/1574526
Images
Figure 1. Methodology for tracing the work footprint. From left to right: floor occupancy of the buildings according to cadastral cartography, buffer of 50 m to the outside, final result after buffer of 50 m to the inside. Own elaboration
Figure 2. Areas of international comparison. The markings are spaced 20 km apart. Prepared by the author based on open data from the Spanish General Directorate of Cadastre, the Department of City Planning of New York City, the French Cadastre du Ministere de l’Action et des Comptes Publics, and the Spatial Data Infrastructure for the Capital District of Bogotá.
Figure 3. Areas of national comparison by provinces, with the delimitation of the Urban Areas defined by the Ministry of Public Works. The geographical positions of the provinces have been altered for ease of representation. The markings are spaced 20 km apart. Prepared by the author according to open data from the General Directorate of the Cadastre.
Figure 4. Ratio between m2 built per inhabitant according to the 2018 cadastre and disposable income per inhabitant in € according to 2016 Personal Income Tax data, by geographical areas, and regression curve. BARC: Barcelona, MAN: Manresa, COR: Coruña, FER: Ferrol, SCQ: Santiago de Compostela, MAD: Madrid, GAN: Gandía, SAG: Sagunto, VAL: Valencia. The suffix 1 indicates central municipality of the urban area, 2 municipality of the urban area with more than 50.00 inhabitants, 3 other municipalities of the urban area. The prefix R indicates other municipalities in the province not attached to the urban areas indicated. Own elaboration
[1] The Community of Madrid is an autonomous community that covers a single province, and for the purposes of international comparison it has the rank of a region with legislative capacity, among others, in urban planning and territorial planning matters
[2] http://www.catastro.meh.es/esp/acceso_infocat.asp . Data in inspire format from 2018 (all areas) and 2019 (Community of Madrid) have been used
[3] https://www1.nyc.gov/site/planning/data-maps/open-data.page#zoning_related. Mappluto has been used in its 18-2-1 version
[4] https://cadastre.data.gouv.fr/ , http://data.iau-idf.fr/ . The cadastral data are from 2019, and the buildability data, from the Îlots Morphologiques Urbains, date from 2014.
[5] https://www.ideca.gov.co/. The cadastral data dates back to 2019
[6] https://www.agenciatributaria.es/AEAT.internet/datosabiertos/catalogo/hacienda/Estadistica_de_los_declarantes_del_IRPF_por_municipios.shtml
[7] The municipal register of inhabitants registers the inhabitants of the municipality. The computer link between municipalities means that, for example, changes of residence from one to the other are registered through registration in the new one, which implies automatic cancellation in the previous one. Assuming its methodological difference with the decennial census, it is a more frequent operational approximation to the population figure
[8] The tables show the percentage of each parameter in the sections where there is a combination of maximum height above ground and the largest number of basements. In other words, the average height is not assessed, but a criterion closer to the perceived landscape is established, logically in the case of the height above ground, and of use for basements. For a weighted census tract to fall under the heading, for example, of more than 9 storeys and more than 3 basements, it is sufficient that at least part of a building included in it reaches more than 9 storeys and a part of the same or another building reaches more than 3 basements
[9] Housing and Land Observatory. Special Bulletin Census 2011 Building stock. General Directorate of Architecture, Housing and Land; Ministry of Public Works. April 2014
[10] For example, according to the data consulted, in the Community of Madrid there would be two plots with buildings of more than 99 floors, with references 0357802VL4105N (Guadalix de la Sierra) and 3785801VK2838N (Las Rozas de Madrid). For those who know the region, these are incoherent data, since the tallest buildings do not exceed 60 floors and are in Madrid, and the data is also contradicted by the photographs that appear in the cadastral files of these plots, verifiable in http://www.sedecatastro.gob.es. Despite specific errors such as these, the basis is, according to the data consulted, highly plausible with other sources and with knowledge of the territory.


Leave a comment