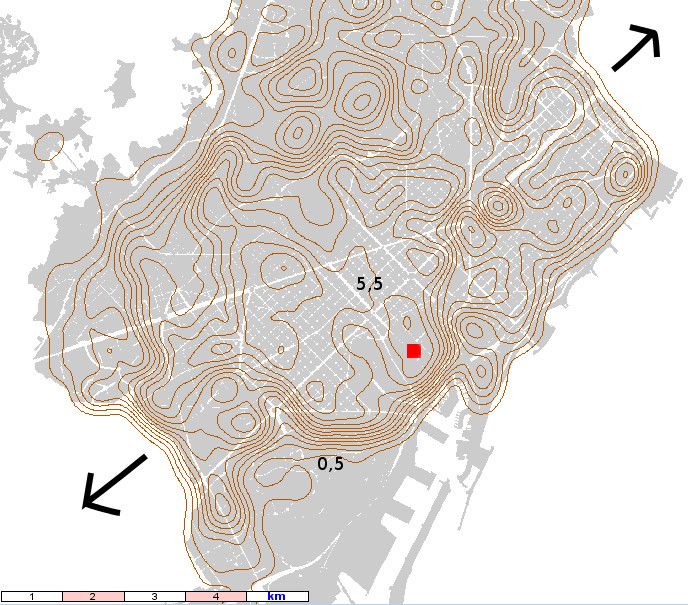
Density can be explained in diverse ways. Here you can see, according to cadastral data, the gradient of the floor-area ratios by contour lines. The kernel calculation does not give show the precise density value, but a more graphical result for large areas.
In Barcelona you can see that the most common density in the urban core is 5,5 (substantially higher than that devised by Cerdá in his 1860 extension plan). The city has an urban tissue whose density is quite homogeneous, surrounded as it is by mountains and the sea and as the core of a larger metropolitan area.
In Bogotá the density dispersion is higher. The extreme areas are located in many cases closer to the mountain ranges


Leave a comment