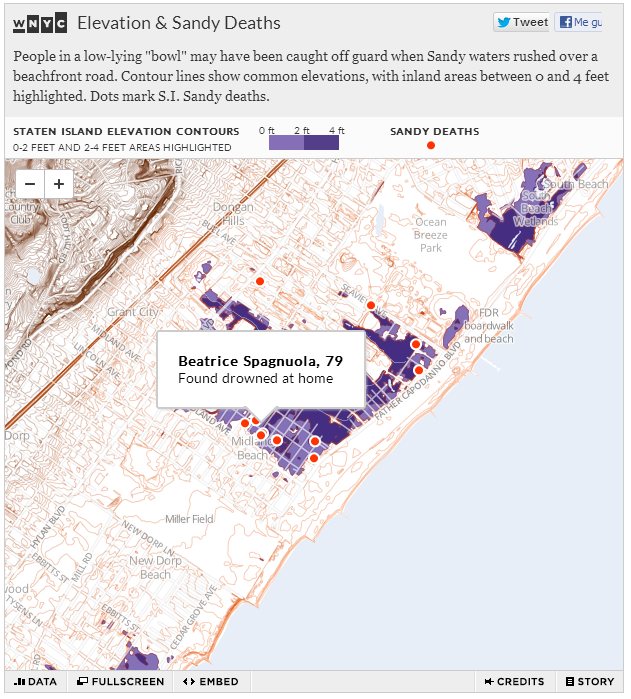
A good example of an elegant and simple map whose reality everyone wishes could have been avoided: deaths in low lying “bowls” due to the Sandy Storm in Staten Island, New York City. A simple map, with the level contours and the dots (see the link) where these people died, with their names.
A good example of an elegant and simple map whose reality everyone wishes could have been avoided: deaths in low lying “bowls” due to the Sandy Storm in Staten Island, New York City. A simple map, with the level contours and the dots (see the link) where these people died, with their names.


Leave a comment