Defining a programme helps make easier what Is complex. The UN have declared 2015 as the international year for light and light related technologies, and international year of soils. At first glance, these seem better starting points than in 2016 (international year for pulses and camelids), but you never know… Nevertheless I think it’s better to choose a subject more focused on the built environment. And specifically, to focus on an issue that is overarching to most of the interesting works I read recently, and that so seems central: the grain of the city.
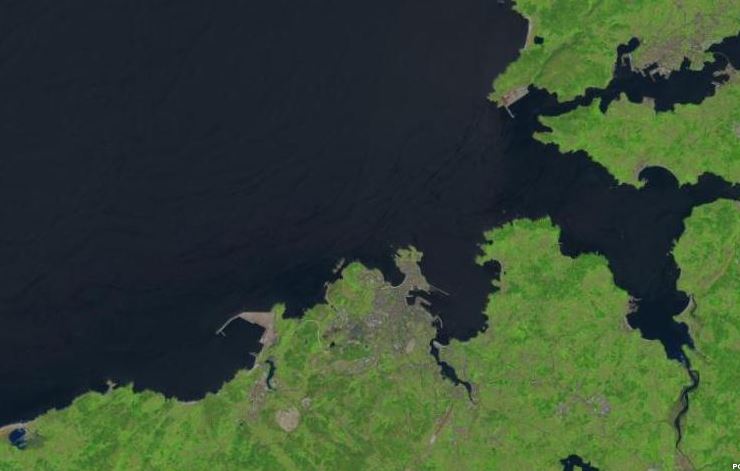
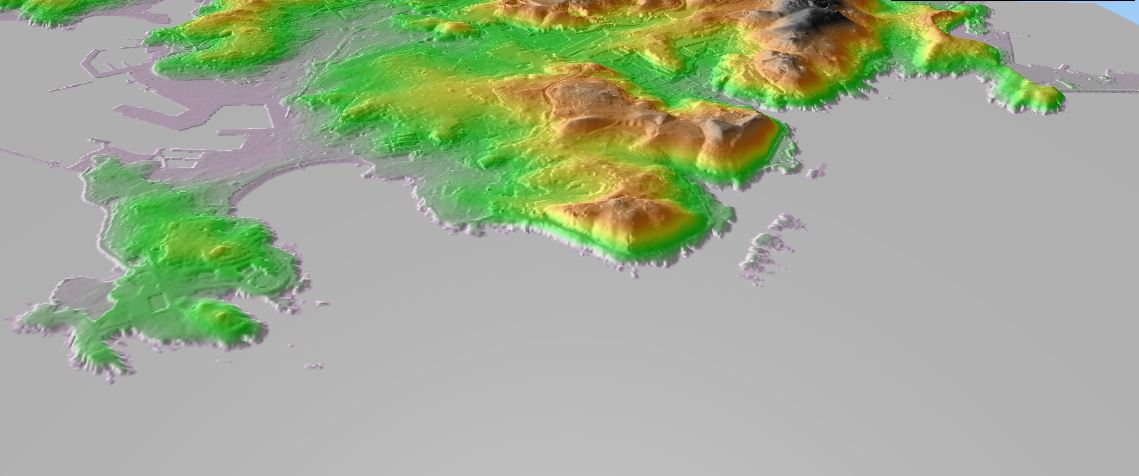
Beware, I’m not talking about grain in the crop sense, but about the different qualities that scales can render when talking about the city or the broader land in which it sits. Mandelbrot did translate a close idea it into the fractal theory, as the presence of visual qualities (although he was a mathematician, he seems to have favoured visual representations of abstract concepts, as structures in data in this case) that seem similar at different scales.
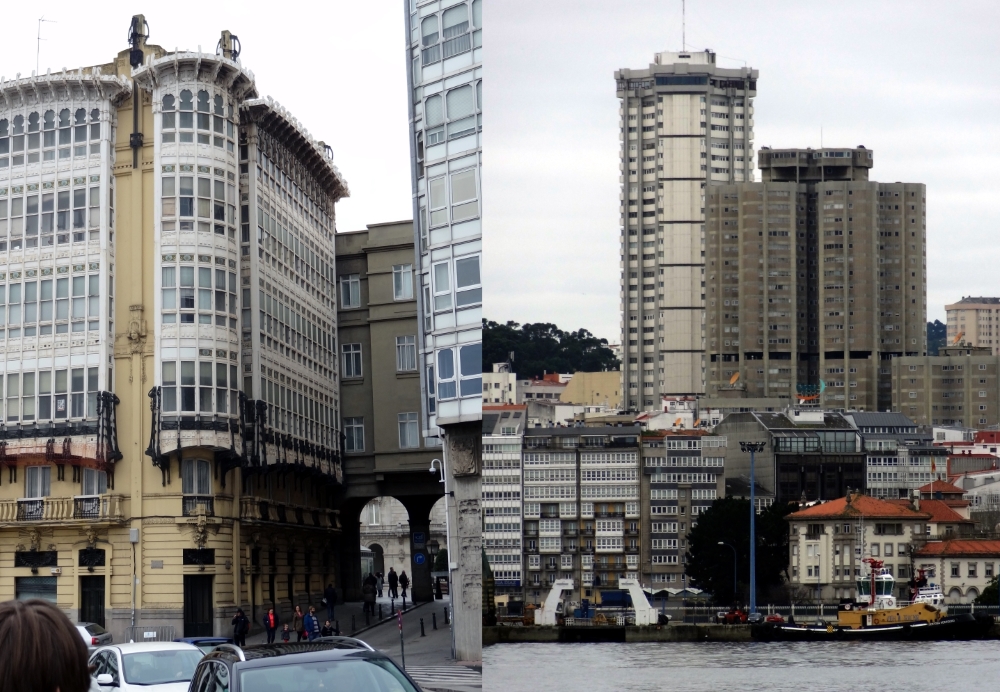
The grain of the city can be physical (an historical area can be much more detailed in so many senses) or immaterial and related to flows and socioeconomic links; the most interesting spaces are those where both detail qualities converge.
The grain raises two issues:
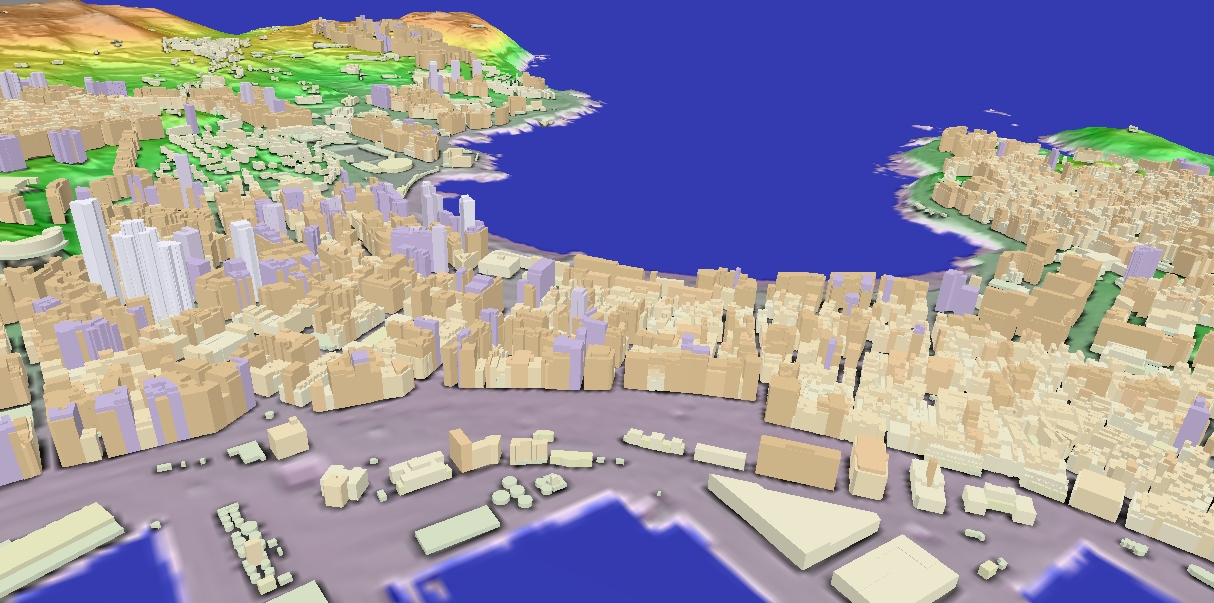
- The ability of our representation instruments to represent the city or the land and convey a given complexity
- The presence (or absence) of complexities on the land, be it in one sense or the other.
This will be the base for the blog during this year, alongside more circumstantial issues. As ever, I’m open to your suggestions.


Leave a comment