This paper was published in Spanish as “Dinámicas de transformación del tejido urbano residencial de Madrid: trama residencial versus trama urbana” in 2020 as part of the IV Hispanic ISUF Congres, held (virtually) in Barcelona, and can be consulted in its original format at https://upcommons.upc.edu/entities/publication/b6f05d8a-1cc0-412f-a22a-8cf670893610 . For those reading from countries like the US, where most homes are single familiy buildings and have their own garden or courtyard, the spanish experience is quite different, as most of us live in much denser areas.
1 Introduction
At the time of writing, the vast majority of the Spanish population and a significant part of the world population is subject to residential lockdown due to the emergency caused by the COVID-19 virus pandemic. It is therefore foreseeable that in the coming months and years the debate on the relationship between urban density and quality of life will reach new intensity. This article takes as a case study the municipality of Madrid, which presents an important variety of situations in terms of density and interrelation between uses, and for this purpose these parameters will be analyzed on three scales.
The first scale is that of the municipality as a whole, from the point of view of building and residential density (number of dwellings per hectare), measured according to morphological parameters; This makes it possible to identify the specific conditions, within the urban fabric, of the areas in which the main use is residential.
The second continues to be that of the municipality as a whole, but going on to analyse the data at the block scale. The block is a relevant operating unit because, in general, it corresponds to a domestic scale in which the conditions of lockdown are more evident. The block implies proximity, intervisibility… It also implies, within a mobility system that gives great prominence to the automobile (and that nothing indicates that it will not continue to be granted) even if it is with nuances, the zero degree of accessibility, by shaping the accessible universe without the need to get off the sidewalk, something especially valued by populations increasingly old.
The third is an approach from the scale of a neighborhood. A part of the Barrio de Salamanca has been taken as an example of dense fabric, with an important variety of uses that have different expressions by levels.
The use of open data from public administrations provides tools that allow a novel analysis of urban phenomena, but nevertheless, as it is a reuse of data created for another purpose, it is not always possible to find all the desirable information in them. This is evident in the case of factors that can be considered mitigating the experience of lockdown. Open data from the General Directorate of Cadastre of the Ministry of Finance in its July 2019 edition in CAT and SHP formats have been used, sociodemographic data from the National Institute of Statistics in terms of experimental statistics on household income and associated information for 2016, and from the Madrid City Council.
2 Analysis
2.1 Weighted urban footprint and residential urban footprint
For the definition of the urban footprint used in the article, a geometric operation is proposed, taking all the built bodies above ground, that is, with a building height of 1 or more floors above ground at the cadastral map, and generating a 50 meters outwards buffer. With the resulting polygons, the same operation is done again, but in the opposite direction: an inner 50 m buffer. This groups the built-up areas between which there is proximity, but also recognises the discontinuities introduced by parks, rivers or large avenues, and which have an impact in terms of spatial perception. In this way, what will be called a weighted urban footprint is obtained and used throughout this paper.
On the other hand, the residential urban footprint will be defined with a geometric operation similar to the previous one, but taking only the buildings in which the main use is residential. This makes it possible to differentiate within the weighted urban footprint those areas that have other uses that contribute to the development of urban functions in interrelation with housing.

Fig. 01. Weighted urban footprint, composed of the residential urban footprint and the remaining areas, in relation to the footprint of the buildings, in the central area of the city of Madrid.
The result of this geometric operation has been cross-referenced with the sociodemographic information by census sections of Household Income Atlas published by the National Institute of Statistics. This source quantifies the number of households per census tract, a figure that until now was only available in the decennial censuses.
It should be noted that in the municipality of Madrid, A areas (residential) cover 94,428 sq km and B areas (other uses) cover 51,904 sq km; that is, a total of just over 145 sq km can be perceived as a weighted urban footprint, based on the criterion adopted, but buildings of predominantly residential use, and therefore homes, are concentrated in 64% of this area. Similarly, the total floor surface (which is not limited to that of buildings and residential uses, but to that of all the uses present in zone A), represents in zone A of the municipality of Madrid 64% of the total figure for the municipality. On the other hand, it is worth noting the spaces with a clear public vocation such as the start of Calle de Alcalá, the University City or the health complex of the Gregorio Marañón hospital, industrial areas such as those of Puente de Vallecas or Julián Camarillo, or the great tertiary axis of La Castellana.
The analysis of density expressed in households per hectare shows the high densities of the south of the Central District, Arganzuela, Pacífico, or the surroundings of Niño Jesús and the La Vaguada shopping center, and confirms the usual perception of higher densities in the south of the city compared to a more open north. If the data of sq m built for residential use per inhabitant in 2016 is analysed, it can be seen that these vary from 21 in the area near the La Vaguada shopping centre to 338 in the area of University City, where the registered residents are few in relation to the residential built area, and with the de facto occupants. since students coming from other municipalities do not always register as city residents; values also high, although somewhat lower, around 200 sq m per inhabitant, are detected in the bussiness axis of La Castellana.

Fig.02 Areas of analysis of the residential urban footprint in the central area of the municipality of Madrid. Own elaboration according to cadastral data
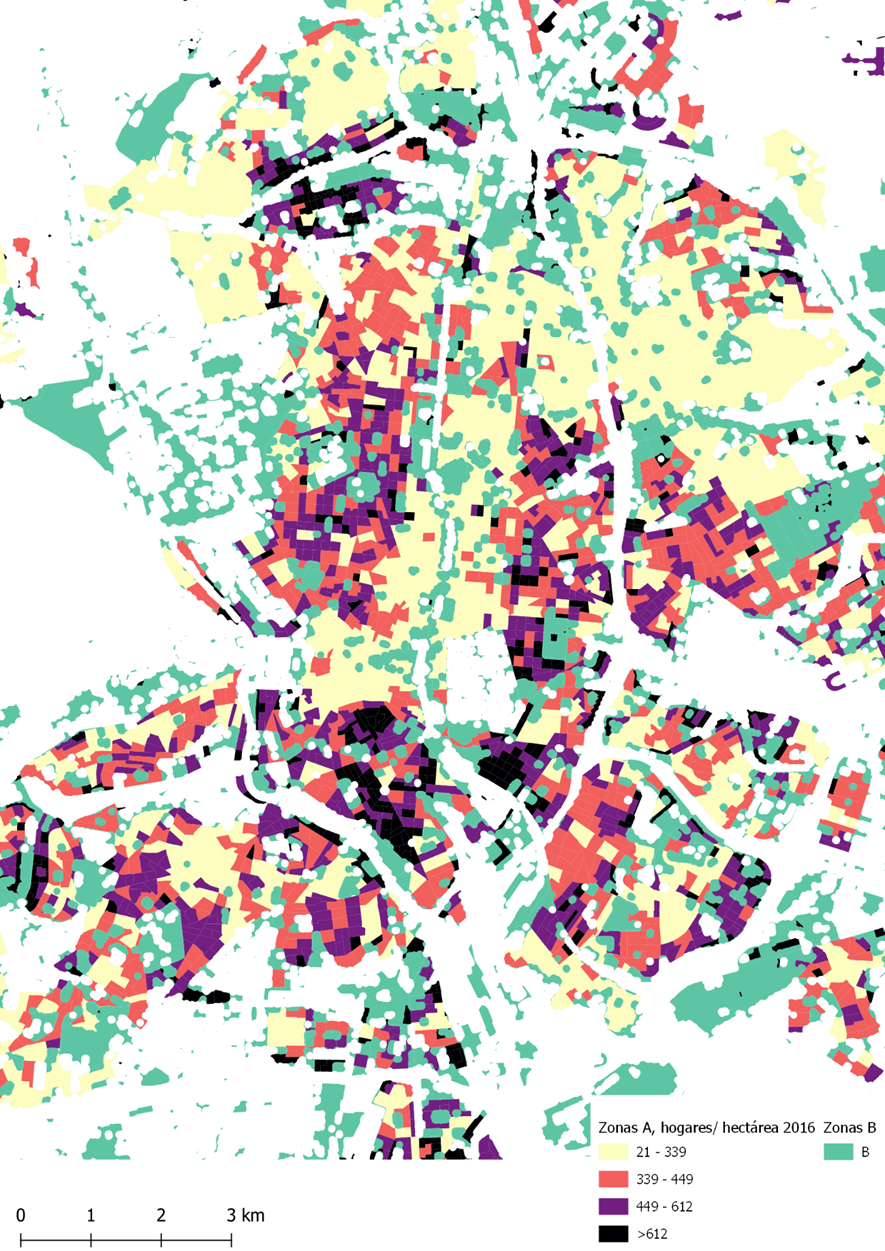
Fig.03 Household density per hectare in 2016 in zones A of the central area of the municipality of Madrid. Prepared by the author based on cadastral data and data from the National Institute of Statistics.
2.2 Madrid’s blocks
The blocks used are those identified by the cadastre, although sometimes they may not correspond to a more traditional morphological vision. The representation in the cadastral map of physical elements that can be considered mitigating the experience of lockdown by allowing a more qualified relationship with the public space, such as terraces or porches, or aggravating factors, such as the condition of interior housing or units with a small surface area, of the spatial experience of the inhabitant has been studied
2.2.1 Cadastral definition of block
The urban cadastre identifies blocks in its graphic and alphanumeric files under the name of mass. In zero lot line areas, this is generally quite evident. In peripheral areas under the open block typology, the blocks are generally adapted to the roads. This definition provided by the cadastre itself has been used, without prejudice to the fact that in more detailed analyses it may be possible to make more specific definitions. Under these conditions, the cadastral map published in July 2019 draws 12,106 blocks, taking into account their codes (in some cases a block comprises several geometries close to each other). Although some are clearly inconsistent with the object of this work, such as the water surface of the Pardo reservoir, this number (12,000 blocks) should be considered as an indicative reference for the analysis, understanding the block as a space bounded by public rights of way.
2.2.2 The lack of an adequate representation of the mitigating elements in the cadastral alphanumeric databases
The general press reports on how Spaniards spend the quarantine taking advantage of their terraces, balconies and other spaces; however, quantifying these spaces is complex. The information published as open data is not homogeneous in the different cadastral formats.
One of the clearest cases is that of the valuation and representation of terraces, porches and gardens, since the covered terraces incorporated into another premises are quantified at 100% and are included in that to simplify the FXCC graphic file, while in the covered terraces not closed on 3 sides, 50% of the surface area is added to that of the main premises, and in the FXCC the TXA code and 50% of its surface area is entered, while the uncovered terraces or rooftops and gardens for private use are reflected as patios, without computing the surface; An analogous case is that of porches, which are also reflected differently depending on the number of closed sides.
The analysis of the cadastral alphanumeric base shows 423,609 sq m of private gardens for 30 plots, reflecting in general singular elements, whose “private” character is not always clear; a garden of just over 125,000 sq m at number 551 of Calle de Alcalá (Garden of the Torre Arias Park), the more than 98,000 sq m of the gardens of the Higher Technical School of Forestry Engineers, or sections of the urban park of Madrid Rio[1]; consequently, they are not mitigating elements from the scale of the blocks. There are also 116,713 sq m of arcades at 50%, in 2,269 plots, although in 1,026 the registered built area is less than 10 sq m, while the plot with the largest area of this destination, with 7,234 sq m, is at the military base of El Goloso, followed by that of the incinerator of Valdemingómez with 6,920 sq m. and the plot of the Iberia Pilot School, with 4,524 sq m of arcades.
As for ground floor arcades, these add up to 100,333 sq m built on 1,612 plots; in the sports facility of Avenida Carandolet, in Colonia Conde de Orgáz, 1,612 sq m of porches are reflected, with a block of República Eslovaca Street, in Las Rosas, in second position, with 1,435 sq m; Analysis of the data shows that the difference between porch and porch in this data is not necessarily that clear and may depend on who compiles it. Only 6 plots reflect uncovered terraces, with a total value for the whole of Madrid of 1,220 sq m, so it is not a relevant data for the study, and the same happens for the terraces covered at 10%, with 5 cases and 506 sq m total built. However, in 2,269 plots, 7,757,413 sq m of surface area in porches and terraces are associated with the use of housing, independent of the previous data, relating to independent uses with these denominations; Their assignment to construction units (premises) for residential use means that elements that are clearly perceptual mitigators of a situation of lockdown must be understood here. However, from the contrast of its geographical location with personal knowledge of the city, it can be deduced, at least, a clear underrepresentation of balconies and other elements.
In conclusion, the data from the alphanumeric database of the cadastre are not sufficient to verify the data on spaces that mitigate the perception of lockdown. On the other hand, the graphic base in shp format disclosed under the cadastre’s own specification reflects the built volumes differentiating terraces and balconies; the exploitation of this database allows us to see that records containing the string “TZA” are reflected at least once in 6,133 blocks, which implies around half of those categorized in the database. Unfortunately, the contrast of these data with personal knowledge of the city shows that the information is not homogeneous and omits many situations in which there are clearly mitigating spaces, such as the balconies in the Plaza Mayor.
2.2.3 Representation of aggravating conditions
The existence of two aggravating conditions of lockdown situations is studied: dwellings with an interior condition and dwellings with a small surface area.
In the cadastre of the Spanish Ministry of Finance on a plot there is at least one property, which is the plot itself. The plot can be subdivided in several properties. In turn, each property is composed of one or more construction units, which correspond to what are colloquially called premises. In other words, in a collective housing building, a dwelling can be a residential property consisting of a construction unit corresponding to the living space, another unit corresponding to a parking space in the basement, and another unit with the storage room on the floor under the roof; Usually, the property is assigned in this case the use of housing, in which it can be assumed that the construction unit with the largest surface area is the habitable space of the same; the habitable construction unit the residential use, the garage space the parking destination, and the storage room the storage destination. It is therefore relevant to differentiate the indicators by property from those by construction units, as well as the uses of the destinations.
The alphanumeric database of the cadastre includes, for the construction units, an indicator of interior premises; It is relevant for the fiscal purpose of the cadastre, since a coefficient of 0.75 is applied for the economic valuation of these premises, reflecting their lower market value. The definition used in the cadastral valuation rules of the dwelling or interior premises is “Dwelling or premises in which all its openings fall to interior courtyards of a plot (not a block) in a closed block building”. With this definition, it is clearly an aggravating factor in the perception of a situation of lockdown. On the other hand, article 7.3.3 of the urban planning regulations of the PGOU of Madrid of 1997, consulted in May 2020 in its December 2019 version on the website of the Madrid City Council, establishes that all dwellings will meet the condition of exterior; this condition implies a series of parameters whose exhaustive verification is not possible without inspection of the property, so it cannot be unequivocally stated that the interior plots according to the cadastre do not meet the condition of exterior housing of the General Plan.
In the cadastral alphanumeric base of the municipality there are 2,263,820 property, of which 1,484,116 are property for residential use, while in 1,552,2015 there are at least 1 sq m of construction units for residential use. This discrepancy is due to the fact that the use is granted according to the majority surface area of the construction units that make up the property, and that there are many cases in which there are housing premises attached to private facilities and buildings for guard functions or similar, as well as collective residence establishments associated with similar elements in which they are not the majority use. It should be remembered that the 2011 Population and Housing Census of the INE reflected for the municipality a total of 1,531,490 homes, a number somewhat higher than that of residential property, but lower than that of construction units for residential use, which would be 1,716,633, establishing a range of values that the next Census scheduled for 2021 should specify.

Table 1. Properties in the municipality of Madrid based on the presence of interior and exterior residential construction units. Prepared by the author according to cadastral data.
The preceding table shows the results of the analysis for the municipality as a whole, which shows that most of the constructed area for residential use (78%) and of the property with the presence of units for this purpose (87%) is located in property in which this use is more than 90% of the built area; In fact, in 80% of the properties that have some area for residential use, there are only construction units for this purpose. It should also be noted that the presence of interior housing construction units is small in surface area compared to the total built area in each size range; It is less than 1% in all groups except for property where the residential use is more than 90% of the surface area, where it is 1.1%. Overall, in the municipality, 22,352 composite residential properties are reflected in the cadastral base, in which the construction units for residential use are all interior. There are cases in which there are properties with a high number of interior residential construction units; a detailed analysis of the database shows that there are 349 properties with more than one interior residential construction unit; While in many cases of property with two or three construction units it could be inferred that these are typologies in which some of the rooms such as clotheslines may be separated from the rest of the dwelling by common parts, in other cases they are complete buildings, foreseeably on a rental basis, with a large number of small housing units. There are many of the 48 properties with more than 10 interior housing construction units, the most representative case being the block between Narváez, Alcalde Sainz de Baranda, Fernán González and 12 de Octubre streets, but there are also other cases of this nature in the central area of the city.
With regard to dwellings with a small surface area, article 7.3.4 of the aforementioned urban planning regulations defines a minimum dwelling as one with a useful area of 38 sq m, allowing the reduction of the useful area to 25 sq m in the event that there is only one living room-dining room-kitchen that can serve as a bedroom and a toilet room. The analysis of the alphanumeric base of the cadastre reflects 75,813 residential properties in which the residential area is the majority and adds up to less than 38 sq m (so its useful area will be lower), and 12,772 in which it does not reach 25 sq m.
2.2.4 The conditions of Madrid’s blocks
The analysis of the above indicators shows that the aggravating conditions of a lockdown situation are not evenly distributed throughout the urban space, but are clearly concentrated in specific areas. These conditions are then represented on maps.
The analysis of the density of residential property by block shows nuances that are not always appreciable in census data, aggregated on a larger scale. The Central District has relatively low densities except on its northern and southern edges, the east of the Salamanca district is clearly differentiated from the west from the axis of Príncipe de Vergara, and Tetuán shows higher values in its southeastern area. Arganzuela and Pacífico also have high values, as well as certain areas of Carabanchel, and in the same way the surroundings of the La Vaguada shopping centre stand out. In contrast, lower densities are clearly seen in the northern areas.
The distribution of the interior residential construction units shows blocks with significant proportions of this condition in Tetuan, Centro, Argüelles, Puente de Vallecas and the section from Alcalá to the east of the M-30, although there are cases in which it should be remembered that as it is a respective proportion of the total residential construction units of the block, in some with a small number of dwellings, such as the Botanical Garden, the high proportion is not comparable to that of other areas, since in this case some of the interior dwellings have views of the Garden.
The map of residential property with less than 38 sq m built shows a special concentration in the south of the Central District, in Arganzuela, in parts of the Salamanca and Chamberí neighborhoods, in the area around La Vaguada, in Avenida de América and areas near Vallecas-Villa in which residential uses are being implemented on previously industrial plots.
On the whole, these three conditions tend to coincide spatially in some areas: Bravo Murillo, Lavapies, and certain areas of Arganzuela have high values of the three conditions analysed, but it is also striking that certain blocks of Chamberí or the Barrio de Salamanca also have a priori unfavourable indicators, since behind the facades of these neighbourhoods there are successive bays of houses with difficult conditions of access to sunlight and ventilation. despite being part of areas with high property prices. Taking into account the data by census tracts analysed in the previous case on households per hectare, in general there is agreement between effective density of use (households registered per hectare, measured by census section) and density of available residential space (residential property per hectare). The differences in graduation explain higher values of built surface area per household in higher-income zones when they are crossed with the values of sq m built for residential use per residential property.

Fig. 04. Residential property per hectare, represented per block.

Fig. 05. Number of residential construction units classified as interior/ total residential construction units ratio, in aggregated data per block.

Fig. 06. Number of homes under 38 sq m of floor surface per block.
2.3 Urban and residential fabric in the Barrio de Salamanca
The analysis of the open data of distribution sketches by plants in FXCC specification of the General Directorate of the Cadastre has been carried out. This description is not distributed floor by floor, but by significant floors, there may be, for example, only three (below ground, ground and upper floors) in a ten-storey building.

Fig. 07. Distribution of uses and situations on upper floors in the blocks between Jorge Juan, O’Donnell, Lope de Rueda and Márquez streets, in Madrid.
With a view to the evaluation of the impacts of the architectural form on the feeling of lockdown, in the upper scheme of the area near Plaza Felipe II in Madrid it is possible to appreciate 331 housing units, of which 95 (interior-b) do not have access to the public road although they have a certain visual openness. although it can be reduced, especially in the most northwestern block, and 21 (interiors-c) only have ventilation through minimal plot courtyards, with minimal visual opening. In terms of surface area, 3.2% are in situation c, 20.7% in situation b, and the remaining 76% have visual access to the public road, although sometimes with a large part of their holes in minimal courtyards. In terms of households, if all the dwellings were occupied, 6.3% would be in situation c, with hardly any vision to the outside, and 28.7% in situation b, with limited visuals. These are generally the smallest units in surface area, which aggravates the experience of residing in these homes.
3 Conclusions
Through the use of open access data, it is possible to detect with a high level of precision in which areas the experience of a health lockdown may be more demanding for households. However, these data do not allow, in general, an adequate approximation to other factors that may contribute to mitigating this situation, such as balconies and other transition spaces between public and private space. In the case of Madrid, it has been possible to verify the existence of dwellings with indications of poor construction quality which, although they are a small percentage of the total, appear scattered throughout the urban fabric. The urban fabric that surrounds them expands the space that can be perceived as their living environment, but areas are detected in which the density of construction and use is high, affecting the experience of their inhabitants; This phenomenon is not exclusive to neighbourhoods with lower income indicators, but also affects areas with high property prices.
Bibliography
Angel, S. 2015. The rise and fall of Manhattan’s densities, 1800-2010. Marron Institute of Urban Management. NYU. https://marroninstitute.nyu.edu/uploads/content/Manhattan_Densities_High_Res,_1_January_2015.pdf
Clabo, N.; Ramos-Vielba, I. (2015). Reutilización de datos abiertos en la administración pública en España y uso de licencias-tipo. Revista Española de Documentación Científica, 38 (3): e097, doi: http://dx.doi.org/10.3989/redc.2015.3.1206
Mora- García, R.T. y otros. 2015. Reutilización de datos catastrales para estudios urbanos. En De la Riva, J, y otros, 2015, Análisis espacial y representación geográfica: innovación y aplicación: 295-304. Universidad de Zaragoza- AGE. ISBN: 978-84-92522-95-8
Roshenthal, Brian M, 2020, Density is New York City’s Big ‘Enemy’ in the Coronavirus Fight. Publicado en el New York Times de 23 de marzo de 2020, https://www.nytimes.com/2020/03/23/nyregion/coronavirus-nyc-crowds-density.html
Temes Cordovez, Rafael. 2008. “Las fuentes catastrales y la identificación de las transformaciones en los tejidos urbanos”. CT: Catastro, nº 64, Madrid, pp 55-78. Doi: http://hdl.handle.net/10251/11114
Secretaría de Estado de Hacienda y Presupuestos. Secretaría General de Hacienda. Dirección General del Catastro. 2011. Manual operativo para la ejecución de los trabajos objeto de encomienda, en cumplimiento del artículo 3 de la orden EHA/1616/2010, de 10 de junio, por la que se regulan las condiciones de la encomienda a la Sociedad Estatal de Gestión Inmobiliaria de Patrimonio, Sociedad Anónima (SEGIPSA), de trabajos catastrales objeto de convenio con entidades colaboradoras.
[1] For example, the cadastral reference 9824809VK4702C corresponds to the section between the Manzanares riverbed and the Paseo de Yeserías.


Leave a comment