This paper was first published in Spanish in 2020 in Territorios en Formación, and can be found at https://polired.upm.es/index.php/territoriosenformacion/article/view/4607
Introduction
This article explores how the policies of opening public data in the Spanish context are influencing the ways of elaborating urban planning, and their potential to introduce greater transformations in the processes of monitoring the evolution of these instruments. Although the concept of open data can also be applied to data generated by private actors, whether public service concessionaires or fully private operators, this aspect is not considered here. This opening of data provides new working material, which is the object of analysis from the concept of urban density, whose measurement has been facilitated thanks to this material.
The article presents the effective progress of the work of the preparation of the doctoral thesis under the proposed title “Approach to urban fabrics through new sources of data. The case of the municipality of Madrid”. Although the main focus of the research is the municipality of Madrid, it has been considered relevant to have comparative examples at an international level. On the other hand, this text has been formalised between April 2020 and April 2021, a period in which the debate on the ability to move from knowledge generated by public action in the face of the health crisis COVID19, disseminated in open formats, to effective public policies has been particularly intense. It is not the purpose of this article to specifically address the relationships between this knowledge, generated in the health sphere, and the orientation of urban policies on matters such as urban density. However, the real scope of the “open” nature of the data, and the capacity for operational interpretation of the same in the legal-technical framework of urban planning, do emerge as clear questions. Although we will not go into this in depth here, the problem of the ethical use of data, described by Zook and others[1] and by Williams[2], also arises; Although these authors raise it to a large extent in relation to the data created or opened in the framework of research, and not so much to the previously open and available data, the need for the contrast of sources underlies their approach.
Reutilization of public documents: policies
This work adresses the open data policies about the reuse of public documents. They are based on the perception that the resources used in the construction of information for the development of public functions can be of high economic and social profitability if they are made public. As will be seen, these policies are not limited to the publication of data, but ideally these should be published with the highest possible level of detail, with the least degree of transformation (ideally raw) and allowing for automated processing. In contrast to the traditional publication of highly processed data in summarized formats, which continues to be carried out and allows a level of general dissemination that does not require a sophisticated technical apparatus of analysis, the data analyzed here require prior reflection on their usefulness and their forms of aggregation to achieve significant results. These policies are also part of the more general framework of transparency in government action; therefore, they are based on the premise that civil society has resources that allow it to process highly granular data in an informed and consistent manner.
The European context
In the general context of the European Union, Directive 2003/98/EC of 17 November 2003 of the European Parliament and of the Council on the re-use of public sector information provides a framework for the development of the concept of open data. In the specific aspect of spatial information, which is particularly relevant for territorial and urban planning, Directive 2007/2/EC of the European Parliament and of the Council, known as INSPIRE (Infrastructure for Spatial Information in Europe), has generated a very useful reference framework. A set of priority topics for publication related to the environment (air, nature, water, noise, waste, industrial emissions and industrial accidents) has been defined and a list of thematic contents, relevant for the preparation of territorial and urban planning, has been grouped into three annexes.
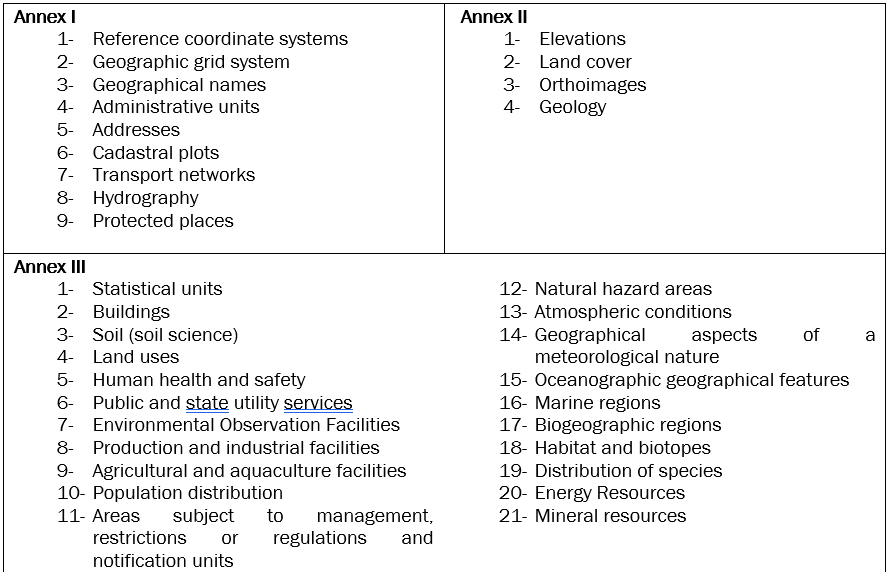
Table 1: Synthesis of INSPIRE themes.
Source: Prepared by the author based on the annexes to Directive 2003/98/EC of 17 November 2003 of the European Parliament and of the Council on the re-use of public sector information
The desire to standardise the specifications of data publications has not yet been realised; its progressive development in stages is expected to culminate on 10 December 2021. As an example, building content can only be downloaded in 17 of the 31 reporting states[3] , and its content is highly variable; even in some states, such as France, there are no INSPIRE publications on the subject but it is possible to access building data based on national specifications.
The Spanish context
In the Spanish context, Law 37/2007, of 16 November, on the reuse of public sector information establishes, in development of the aforementioned European Directive 2003/98/EC, a framework for the concept of open data. In its preamble, the Law states that the information generated by public bodies is of great interest to companies when it comes to operating in their areas of action, contributing to economic growth and job creation, and for citizens as an element of transparency and a guide for democratic participation. The annex of definitions of the Law describes open data as that which anyone is free to use, reuse and redistribute, with the only limit, where appropriate, of the requirement of attribution of its source or recognition of its authorship. In accordance with Article 3 of the Law, re-use is understood to be the use of documents held by public sector administrations and bodies, by natural or legal persons, for commercial or non-commercial purposes, provided that such use does not constitute a public administrative activity, excluding from the concept the exchange of documents between administrations and public sector bodies in the exercise of their public functions. Reuse must be authorised by the administration that processes or safeguards it, and is not applicable to data subject to restrictions assessed by the law itself. Reuse can be free, subject to standard licenses, or subject to prior request with specific conditions. Article 6 prohibits the granting of exclusive rights of reuse in favour of third parties unless they are necessary for the provision of a service of public interest, and always under periodic review of the permanence of the exclusivity motivation.
This framework is specified by the Resolution of 19 February 2013, of the Secretary of State for Public Administrations, which approves the Technical Standard for Interoperability for the Reuse of Information Resources. Section III establishes that priority will be given to the reuse of documents and information resources of greater relevance and social and economic potential; that such documents shall be primary, avoiding modifications or alterations of existing information; that the granular level will be as fine as possible, avoiding additional aggregations; that they will have associated structured information that allows their automated processing; and that the documents and information resources prepared or collected periodically will be updated to their latest versions and the date of last update will be indicated, as well as the period of the same. The process of adopting these forms of work and their concretization with the use of standard licenses, described by Clabo and Ramos-Vielha[4], is evolving.
In the specific case of information of a special nature, of clear relevance in planning matters, the aforementioned INSPIRE Directive has been transposed into Spanish law through Law 14/2010, of 5 July, on geographic information infrastructures and services in Spain (LISIGE)[5]; In its preamble, it is indicated textually that this text seeks to eliminate an obstacle to the full use of the available data, which derives from the loss of time and resources caused by the search for existing geographical data or by the need to locate the most useful for a particular purpose.
The open data available for the preparation of planning in Spain are published both by the General State Administration and by the rest of the Public Administrations, with heterogeneous specifications and formats. The portal datos.gob.es reports in April 2021 305 open data initiatives, of which 43 are from the General State Administration, 18 from the Autonomous Administration and 230 from the Local Administration. In the specific field of spatial information, the National Geographic Institute publishes a significant amount of information that makes up the basic Reference Geographic Information on scales up to 1:25,000, and even below in terms of digital surface and terrain models, and in turn the Autonomous Communities and some Provincial Councils publish their own information of a similar scope. although they usually go down to scales of 1:10,000 or 1:5,000. The cartographic information associated with the Survey of Local Infrastructures and Facilities, managed by the Provincial Councils and potentially relevant for planning work on rural municipalities, shows an even greater dispersion in terms of accessibility to the data and its formats.
The case of cadastral data is illustrative of the situation of open data usable in planning, having described its possibilities of use from different approaches by García Martín[6] (morphological study), by Temes Córdovez[7] (transformation dynamics) and by Martín Consuegra Ávila[8] (energy efficiency). Although there are relevant antecedents of open sources on land uses such as the European Corine Land Cover project[9] or the Spanish SIOSE,[10] the latter even being a reference incorporated into the regulations of territorial planning in the Valencian Community[11], the cadastre presents a much greater resolution and detail, being clearly more operational in urban or metropolitan areas. Each of the 5 tax authorities in Spain (the Ministry of Finance in the case of the provinces under the common regime, and its counterpart in each of the four foral provinces) publishes its information on plots and buildings in its own format, and even manages its own publications on the Inspire geoportal. With regard to the 46 provinces of common regime, although their dissemination is made under a common specification, this does not imply a total standardization, an example being the variation according to the Territorial Management of the plant name codes in the alphanumeric files that describe the premises present in each building. On the other hand, there are significant variations in quality and updating between the data of different municipalities, and even within the same municipality, as the system works as a palimpsest subject to continuous punctual updates. Despite these circumstances, it has become a widely used source, as it is commonly used by professional and non-professional administrators through the consultation of individual data by plot, and when its editable cartography is downloaded, it provides a greater wealth of information, through its databases, than the merely topographical cartography produced by other sources. All this without taking into account that in many municipalities it is almost the only digital cartography available at sufficient scales for planning work on urban land.
At the municipal level, the situation is equally varied. Municipalities with large populations such as Madrid can count on open data portals of great thematic richness and publication quality, but in many the available information is limited or non-existent.
The result is that municipal planning work is often thought of today as a combination of different sources.
Other geographical contexts
In the United States, the federal government’s 2013 Open Data Policy requires that next-generation government data be made public in open formats and susceptible to automated processing, ensuring privacy and security in any case. The federal government has implemented Title II of the Foundations for Evidence-Based Policymaking Act of 2018, through the data.gov portal, in which federal information and information from some states, counties and cities is published. In parallel, many states, counties and municipalities publish open information under local specifications. The concept of respect for privacy, similar in its formulation to that of European directives, has different readings; for example, the MapPluto real estate dataset in New York City publishes the names of owners of homes not subject to regimes similar to horizontal property, contrary to what the Spanish cadastre does. Shlomo Angel’s studies are an illustration of the possibilities of this system[12].
In Colombia, Law 1712 of 2014 on Transparency and Access to National Public Information defines open data as all primary or raw data that is in standard and interoperable formats that facilitate access and reuse, which are in the custody of public or private entities that fulfill public functions. and that they are made available to any citizen freely and without restrictions, so that third parties can reuse them and create services derived from them.
Reuse of data for planning and monitoring processes – problems
The concept of re-use of public documents is applied in Spain, as we have seen, to uses that do not constitute a public administrative activity. A priori, therefore, it would not cover the case of the preparation of the planning. However, this concept is operative in both public and private initiative instruments for those cases of data whose publication is sufficient for the preparation of the planning, as it is not affected by legal or operational restrictions, and in which it is understood that it is possible to use a set of data generated for one purpose for a different purpose. It is also relevant in cases of public participation, in which data produced with public resources are likely to be used as an evidentiary argument in contrast to public proposals, and in general for any action linked to the discussion or debate on current regulatory instruments. In addition, the reflection of legislation on the time savings that data accessibility entails through these policies is clearly relevant. This raises the following issues:
- The need for a framework for translating data created for a specific purpose for re-use for another purpose; Without such a translation framework, which is the one that allows different sources to be usefully integrated, there is certainly a use, but its results can produce erroneous interpretations. A clear example is the case of cadastral information, created for a tax purpose. The constructed area that appears in the cadastral bases is an area of land that has a specific use and is taxed for that use, and in the case of having a building it is an area on one or more levels also subject to taxation according to the corresponding value presentation. It does not necessarily imply coverage under a roof, as does urban built area, and it registers areas that may not be computable in urban planning. In this way, the cadastre reflects surface car parks, golf courses, gardens… therefore, filtering by uses allows an approximation to urban planning parameters. Similarly, the division between urban and rural cadastre does not always correspond to the updated urban classification of the land, for example in the case of developable land.
- Temporal coherence, which opposes palimpsests to temporally uniform data. Spanish cadastral data, and in general comparable data in other countries, make up a palimpsest in which complete revisions are carried out with low frequency, while the updates that are published quarterly correspond to registrations and cancellations as a result of their own work, coordination with other public administrations and by other means such as corrections of errors at the request of interested parties. There is frequent, but not often exhaustive, updating, especially when it comes to building interiors. In contrast to these palimpsests, the satellite images correspond to a single moment for the whole of each one, with minimal variations in time between those that make up a pass; for example, the European Space Agency’s Sentinel 1A radar satellite reflects the whole of the Community of Madrid in a single image on 6 April 2020, which is repeated on the 18th, and there is another image that covers the equally complete Community, although on a different trajectory and coverage, on the 12th. The data on permanent traffic capacity by points published by the Madrid City Council provide information for each hour in each direction of circulation.
- The way the data is obtained. As already mentioned, cadastral data come from a plurality of sources, satellite or sensor traffic sources whose quality may depend on various factors, and those relating to commercial premises of the Madrid City Council, from declarations by the administered parties that are assimilable to the concept of palimpsest.
- The frequency of dissemination of data, which can be extraordinarily variable. As already mentioned, cadastral databases in their INSPIRE format and in their national formats are published updated three times a year by municipalities, and satellite images may have higher frequencies of publication, as this occurs hours after they are captured. Much of the Madrid City Council’s open data is published monthly.
- As a consequence of the above, the coherence of the different sources of open data, and the control of their quality. Satellite images make it possible to detect urban development works in advance of their reflection in the cadastre, which occurs some time after their physical execution. The cadastral databases have occasional errors[13], inevitable in a body of documentation with almost 39 million urban properties and more than 39 rustic properties in the whole of the territory under the common regime. As Green, Congalton and Tukman point out[14], in the adoption of geospatial data, an initial enthusiasm for a new source with seemingly incredible possibilities is followed by an awareness of the need for quality control. The example of the dissemination as open data of the SRTM (Shuttle Radar Topography Mission) dataset on global altimetry, which has been useful for many cooperative works subject to resource constraints, is finding its limits in the application to problems such as the analysis of the threat of sea level rise and subsidence in deltaic areas[15].
- The ability of the subjects to have effective access to public information that can be reused in allegations, lawsuits or other actions to question, or merely control, public action. This ability is not limited to accessing data, but also to the possibility of using it effectively without technological barriers. Tools such as the virtual cadastre office (www.sedecatastro.gob.es) are commonly used by those administered in the processes of allegations. The publication of geographic data in formats that can be processed by open source programs and at no cost is an ongoing advance in most Public Administrations; In addition to helping transparency in front of the administered by potentially allowing the evaluation of parameters over large extensions, and therefore an analysis of policies and not only of particular cases, this facilitates interoperability with other administrations.
The analysis of urban density: three case studies
Density is a central parameter in the analysis and regulation of urban processes; however, its analysis has historically been hindered by the scarcity of detailed and up-to-date data. Urban planning has usually worked without having precise data on built densities, and with data with fairly high levels of aggregation in demography and, above all, employment; The use of new public sources of open data, especially cadastral or similar, available for reuse, makes it possible to overcome this situation.
The following case studies are examples of analyses carried out in conditions not linked to professional planning work, but seeking to have quality levels typical of that situation. They are examples of data reuse that provide knowledge for the preparation of planning, or for its innovation.
Comparative parameters of urban density in urban regions
The paper[16] presented at the ISUF-H-2019 International Congress presents a comparative analysis between the contexts of urban density in various Spanish and other territorial areas. The results are based on a density analysis methodology that weights density by reducing the denominator that expresses the area of land that is less than 50 meters from the building footprints reflected in the cadastral source, which allows a more effective application to regional-scale environments. where the census tracts that provide sociodemographic data can be of great extension.
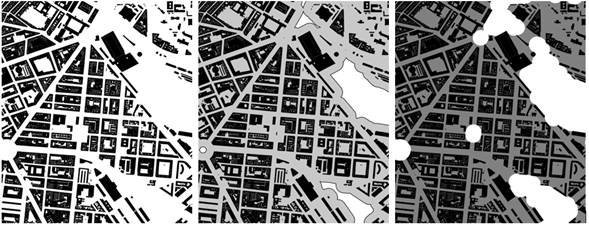
Figure 1. Methodology for tracing the work footprint. From left to right: floor plan occupation of the buildings according to cadastral mapping, buffer of 50 m to the outside, final result after buffer of 50 m to the inside
Source: Author, on cadastral data for the city of Madrid, included in the aforementioned ISUF-H-2019 paper

Table 2: Built areas (sum of all floors), expressed as “C”, total and relative to housing, and their relationship with the volume of population, with the extension of the political-administrative area, and with the calculated footprint surfaces.
Source: Author, based on open data from the Spanish General Directorate of Cadastre, the Department of City Planning of New York City, the French Cadastre du Ministere de l’Action et des Comptes Publics and the Institut Paris-Région, and the Spatial Data Infrastructure for the Capital District of Bogotá. Included in the aforementioned paper ISUF-H-2019
According to the morphological criteria used, the weighted built footprint of the Community of Madrid has a density almost equivalent, in global terms, to that of the central areas of New York or Bogotá, while the provinces of Barcelona and Valencia have somewhat lower, but equally high, values. However, the province of A Coruña and the Île-de-France Region have much lower values, which can be associated with more pronounced dispersion dynamics.
Monitoring of the evolution of land occupation in the metropolitan area of Madrid
The European Space Agency’s Copernicus programme operates a suite of Earth observation satellites; the most susceptible to reuse in urban planning are those of the constellations Sentinel 1 (radar images), and Sentinel 2 (optical images). The maximum spatial resolution in both cases is 10 meters, which allows a territorial scale analysis.
The figure below shows the composition of three Sentinel 1 radar images of 3 April 2016 (blue band), 5 April 2018 (green band) and 6 April 2020 (red band) over the Madrid metropolitan area. The built elements appear in shades of white when they have not undergone changes, while they adopt shades of yellow when they have changed between 2016 and 2018 and red when the change has been in 2020. The following stand out as changes in this period: (A) mainly single-family developments in Boadilla del Monte, (B) the UZP-2.01 Desarrollo del Este-El Cañaveral area, where the building process has begun, (C) the Los Gavilanes Industrial Estate, in Getafe, with the presence of logistics platforms such as Amazon, and (D) the San Fernando industrial estate, around the SUP-I-1 area.

Figure 2. Composition of vertical polarization images obtained by the constellation Sentinel 1 for April 3, 2016, April 5, 2018 and April 6, 2020
Source: Author, based on data from the Copernicus Programme of the European Space Agency (scihub.copernicus.eu/)
A more detailed analysis of the area of Boadilla del monte by contrasting open data of public origin with a common aerial photography access service, such as Bing maps, shows a certain delay in the reflection of the building data that can be presumed in the image of Sentinel 2 in the cadastre in its publication in Inspire format. This, in turn, corresponds to the extraction of the data on October 25, 2019, which is why it has a delay with respect to the version represented in the cadastral viewer as of April 2020, which leads to an underrepresentation of more than 50,000 sq m built. And in any case, it is clear that the image represented by Bing maps, which is one of the forms of access with the lowest barrier to entry, has a lag with respect to reality of more than 2 years; the verification of the images published by Google maps shows that the latter are surely from 2019.
Figure 3. Evolution of the images of the western area of Boadilla del Monte obtained by the constellation Sentinel 2 for July 12, 2015, April 17, 2018, and April 3, 2020
Source: Authors, based on data from the Copernicus Programme of the European Space Agency (scihub.copernicus.eu/)
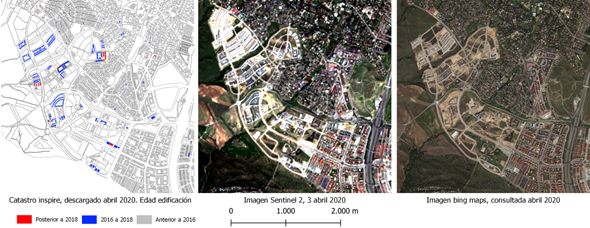
Figure 4. Open cadastral and satellite data, and the open private service Bing maps, from the western area of Boadilla del Monte, which have been accessed during April 2020
Source: Prepared by the author based on data from the Directorate-General for Cadastre, the European Space Agency’s Copernicus Programme (scihub.copernicus.eu/) and Bing maps (maps.bing.com)
On the other hand, the data on urban planning published by the Community of Madrid through its Territorial Information System[17] correspond to the documents definitively approved between 1967 and 31 December 2016, of which 64% are available in pdf format and can be consulted and downloaded from the viewer, and 99% are represented cartographically and described in their parameters. In other words, it is extensive information, with variable granularity, and with a delay of 3 years with respect to the current situation. Although this granularity can be reconstructed in the case of the most recent files through publications in official gazettes, these do not always include graphic documents, and make it more difficult to access the data.
Overall, the open data allow in this case a fairly precise approximation of the situation of the territory in terms of physical elements of urbanization and building, although with more difficulty in terms of its urban legal status. The cross-referencing of these different data allows a better approximation to the real situation.
Local Contrast of Data by Fieldwork
The actual fieldwork contrast of pre-existing data is a classic part of urban planning work. In this case, an illustrative flow of an approximation based on cadastral data to two blocks of the city of Madrid, those between Cavanilles, Doctor Esquerdo, Granada and Sánchez Barcaiztegui streets in the district of Retiro, and its contrast with the information obtained through fieldwork, from the public road, is proposed. in April 2021. The choice of these blocks is due to situations of updating information that can be presumed taking into account the diversity of ages of the building, the development in progress of development planning and the presence of buildings of heritage value.
As a basis for fieldwork, cadastral data is contrasted with sources such as those provided by the Madrid City Council’s urban planning portal, available at address http://www-2.munimadrid.es/urbanismo_inter/visualizador/index_inter.jsp. The cadastral description of the southern block currently comprises 18 plots, after the division through the APE 03.10 “Metro) of the old plot 02, and the north has 11 plots, after the division into four of the old number 01 through the same operation. The temporal sequence of records on planning and cadastre in this area is as follows:

Table 3. Urban planning sequence and generation of open information of the blocks under study
Source: Author, according to data from the municipal urban planning portal and the virtual office of the Cadastre
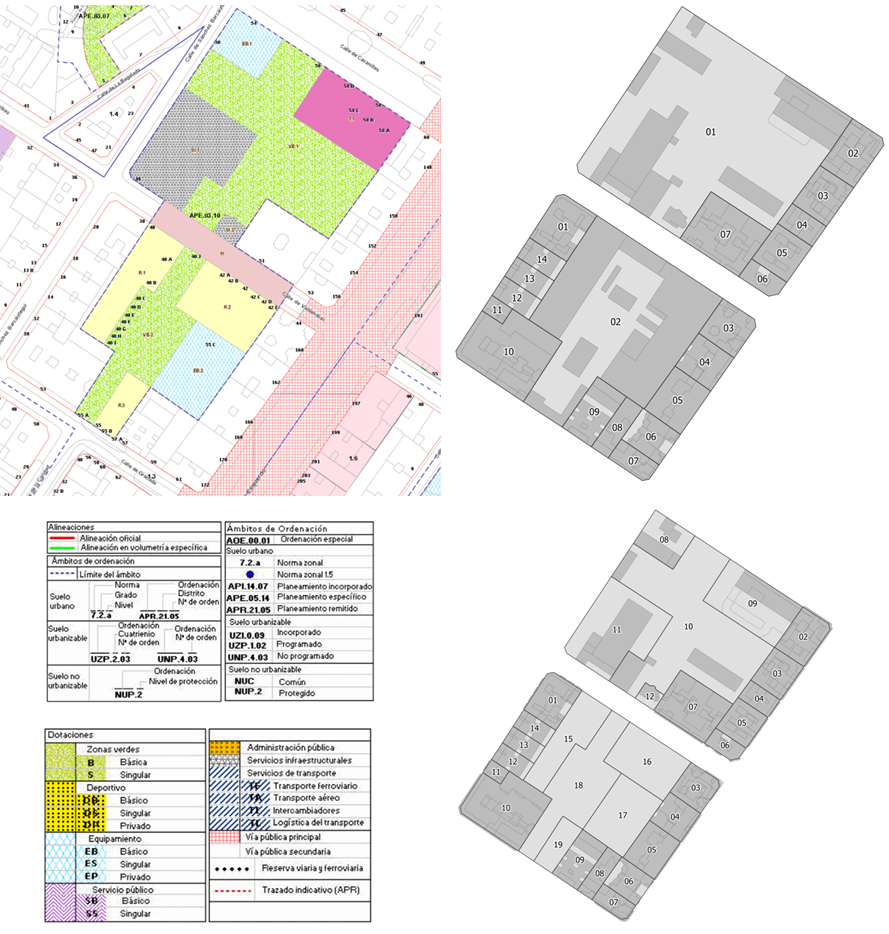
Figure 5. Left: Layout of the APE 03.10 “Metro”. Right: cadastral plan on 4 February 2002 (top) and from 9 January 2018 (bottom)
Source: Urban planner of the Madrid City Council (http://www-2.munimadrid.es/urbanismo_inter/visualizador/index_inter.jsp). Electronic headquarters of the General Directorate of Cadastre (sedecatastro.gob.es)
The information provided by the municipal urban planner allows us to know the current planning and the licenses granted, but does not provide information on the situation of the building. The 17,537 sq m of lucrative residential buildable area allowed by the APE, in an advanced state of construction, are not yet reflected in the open cadastral database, but the existing buildable area on the tertiary plot corresponding to the current Metro offices, of 5,793 m2, although no data on its interior distribution is published. On the other hand, the constructed area of 973 sq m of the EB.1 endowment plot is reflected, materialized by rehabilitation and expansion of pre-existing built bodies, and below the 1,310 sq m allowed by APE 03.10.
The data on the buildings show the presence of 2007 records of construction units, of which 5, corresponding to the plots of the southern block in the process of construction, register 0 units and surface area 0. For the remaining 2,002 registrations, 758 correspond to housing use, with a total of 54,730 sq m built specifically for these dwellings and 60,380 sq m built for the residential assets in which they are included (with common parts and associated elements within the real estate). In the description of the distribution by floor of the uses, up to 2 basements and 8 floors above ground are coded, as well as mezzanines, and the plots belonging to the APE are coded with an EU floor. The summary of the data by floor and usage is as follows:

Table 4. Summary of cadastral data of built areas of the blocks under study
Source: Author, based on data from the virtual office of the Cadastre
The contrast of the data in the fxcc files, which indicate the date of capture of the graphic information, with the construction dates that appear for each plot, shows that although a significant part of the buildings date from several decades ago, the date of capture of the graphic information is, in the oldest case, of 2016, and in five plots it dates from two years ago at most, which justifies the high correspondence that can be seen between fieldwork and open data. In the analysis of the data from the sketches of the distribution of uses by floor in the plots, it can be seen, however, that the modifications of plot boundaries included in the updates of the cartographic base between 2016 and 2018 are not always rigorously transferred to the smallest scale. On the other hand, there are also differences at times in the reflection of the accesses to the car parks when they form an entrance in the façade shared with the access to the portals.
Photographic information on façades, which may be useful to prepare for fieldwork, is not available for any of the plots affected by the APE, not even for those that are subject to heritage protection such as Valderribas 49-a, whose configuration should not change. This information is apparently very recent judging by its correspondence with the current state, in which there are only a few variations of commercial premises. The photographs also show the differences in criteria in the coding of floors between cadastre and urban planning: in plots 2829612VK4722H, 2829613VK4722H, and 2829614VK4722H the cadastral information reflects dwellings on floor -1, which according to the cadastral photographs themselves would correspond more to an urban situation of a semi-basement than a basement. In conclusion, the open cadastral data show in this case study, in a context of visual recognition from the public road, a high apparent correspondence with the observed reality.

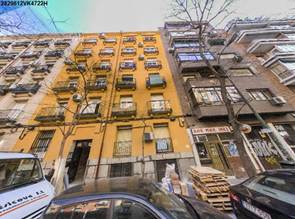
Figure 6: Cadastral photographs of plots 2829613VK4722H and 2829612VK4722H.
Source: Electronic headquarters of the General Directorate of Cadastre (sedecatastro.gob.es)
Conclusions
The availability of new sources of disaggregated, quality data with a high frequency of updating allows new ways of approaching urban phenomena. To take advantage of them efficiently, it is necessary to have transdisciplinary theoretical frameworks that allow an adequate and rigorous approach to the reuse of data generated for purposes other than urban planning; this need, which has always been present in urban planning information processes, is increased by the need to process a much higher volume of information but whose management and control of coherence also presents a greater complexity, something already intuited in the development of initiatives such as the INSPIRE Directive of the European Union. A simple example of this need for conceptual frameworks for reuse is in the case seen of the reflection of the different levels of the building, which in the cadastre may appear below ground, or as the case may be as one more floor, and which in the planning, which operates by municipal areas with specific characteristics, may vary according to the municipality; As different open data sources are incorporated into planning processes, this need for coherent frameworks will increase.
In the specific field of urban density analysis, there are possible advances of interest, which make full sense when they are integrated with other factors. The three case studies show the possibility of obtaining results at different scales. These are conditioned by the differences in criteria that may exist between countries in international comparison, by the possible time lags between sources in the second, and by the complexity of fieldwork beyond visual inspection from public roads in the third. The example of the cadastral source shows a possibility of a deeper and richer approximation to the data on the physical containers of the uses, despite difficulties such as the lack of a common definition of the housing unit or the height position of the uses in the buildings (cases of semi-basements or attics). But a more integrated vision of urban planning requires integrating other factors, either due to legal requirements[19] or the need to address specific phenomena in the field of work. These new ways will allow density analysis to integrate, as is already possible in part today in some Spanish areas such as the municipality of Madrid, data on containers, generally more static in their regulation and their rate of physical transformation, and contents, which can be much more variable.
The impact that this new availability of data has on the development of urban planning work is not that of greater ease or speed for the development of the instruments, but the possibility of a higher quality of the final product provided that sufficient resources are dedicated to this goal. The risk of trying to address a reduction in planning times and budgets through the mere use of open data can have the counterproductive effect of concentrating attention on the discrepancies between administrative records and physical reality, or even producing erroneous results, as seen in the example mentioned by Midenhoud on the use of low-resolution altimetry data in coastal areas.
Open data provide a better basis for the preparation of field and desk work in the diagnostic phases, as well as an overview that can support the motivation for proposals and policy provisions. To this end, the technical work of interpretation and integration implied by the concept of reuse is essential, which must be accompanied by the contrast of the results with the inhabitants through the processes of participation, linking with the aforementioned works of Williams, Zook and others. The tendency observable in many Spanish municipalities to distance revisions of general planning over time and the growing availability of relevant information may also lead to new approaches; They would enhance the monitoring of the current plans through this open data and its participatory interpretation, as a basis for introducing adjustments in the planning of the limited scope to respond to the evolution of the context.
Although it exceeds the scope defined for the article, it cannot be ignored that open data are not the only ones that exist in the context of planning. The formation by private actors of databases on various topics of territorial relevance, supported in many cases by the use of constellations of satellites and other vehicles carrying sensors of high spatial, radiometric and temporal resolution, has generated a market for derivative products for purposes such as precision agriculture, economic intelligence or the production of cartography itself. The contrast of these data with the open data will be part of the debate on urban planning and public participation processes.
References
Angel, S. (2015). The rise and fall of Manhattan’s densities, 1800-2010. Marron Institute of Urban Management. NYU. https://marroninstitute.nyu.edu/uploads/content/Manhattan_Densities_High_Res,_1_January_2015.pdf
Clabo, N.; Ramos-Vielba, I. (2015). Reutilización de datos abiertos en la administración pública en España y uso de licencias-tipo. Revista Española de Documentación Científica, 38 (3): e097, doi: http://dx.doi.org/10.3989/redc.2015.3.1206
García Martín, F.M. (2014). “Estudios de Forma Urbana en la Región de Murcia. Densidad y Compacidad del casco urbano de Lorca”. In VII Anuario de jóvenes Investigadores. Universidad Politécnica de Cartagena
Green, K, Congalton, R.G., Tukman, M (2017). Imagery and GIS : best practices for extracting information from imagery. Esri Press
Martín Consuegra Ávila, F. (2019). Análisis de datos espaciales para la erradicación de la pobreza energética en la rehabilitación urbana. El caso de Madrid (Tesis doctoral). Departamento de Urbanismo y Ordenación del Territorio. Universidad Politécnica de Madrid
Mindehoud, P.S.J et alt (2019) « Mekong delta much lower than previously assumed in sea-level rise impact assessments. Nature Communications, 2019;10:3847
Temes Cordovez, R. (2008). Las fuentes catastrales y la identificación de las transformaciones en los tejidos urbanos. CT: Catastro, nº 64, Madrid, pp 55-78. Doi: http://hdl.handle.net/10251/11114
Williams, Sarah (2020). Data action. Using data for public good. The MIT Press
Zook, M et alt, (2017) « Ten Simple Rules for Responsible Big Data Research”. PLOS computational Biology 13, no. 3 (March 30, 2017): e1005399. https://doi.org/10.1371/journal.pcbi.1005399.
Williams, Sarah. Data Action (p. 377). MIT Press. Edición de Kindle.
Directiva 2003/98/CE, de 17 de noviembre de 2003, del Parlamento Europeo y del Consejo, relativa a la reutilización de la información del sector público. https://eur-lex.europa.eu/legal-content/ES/TXT/PDF/?uri=CELEX:32003L0098&from=ES
Directiva 2007/2/CE del Parlamento Europeo y del Consejo de 14 de marzo de 2007 por la que se establece una infraestructura de información espacial en la Comunidad Europea (Inspire). https://eur-lex.europa.eu/LexUriServ/LexUriServ.do?uri=OJ:L:2007:108:0001:0014:ES:PDF
Ley 14/2010, de 5 de julio, sobre las infraestructuras y los servicios de información geográfica en España
Ley 37/2007, de 16 de noviembre, sobre reutilización de información del sector público
[1] Zook, M et alt, (2017) « Ten Simple Rules for Responsible Big Data Research”. PLOS computational Biology 13, no. 3 (March 30, 2017): e1005399. https://doi.org/10.1371/journal.pcbi.1005399.
[2] Williams, Sarah (2020). Data action. Using data for public good. The MIT Press
[3] The INSPIRE standards have been adopted by Iceland, Liechtenstein, Norway, and Switzerland. The United Kingdom of Great Britain and Northern Ireland does not currently publish its topics on the INSPIRE geoportal, although its legislation on leaving the European Union maintains interoperability.
[4] Clabo, N.; Ramos-Vielba, I. (2015). Reutilización de datos abiertos en la administración pública en España y uso de licencias-tipo. Revista Española de Documentación Científica, 38 (3): e097, doi: http://dx.doi.org/10.3989/redc.2015.3.1206
[5] The text has been amended by Law 2/2018, of 23 May, which introduces clarifications in the articles so that it complies with the full transposition of Directive 2007/2/EC
[6] García Martín, F.M. (2014). ” Estudios de Forma Urbana en la Región de Murcia. Densidad y Compacidad del casco urbano de Lorca “. In VII Anuario de jóvenes Investigadores. Universidad Politécnica de Cartagena
[7] Temes Cordovez, R. (2008). Las fuentes catastrales y la identificación de las transformaciones en los tejidos urbanos. CT: Catastro, nº 64, Madrid, pp 55-78. Doi: http://hdl.handle.net/10251/11114
[8] Martín Consuegra Ávila, F. (2019). Análisis de datos espaciales para la erradicación de la pobreza energética en la rehabilitación urbana. El caso de Madrid (Tesis doctoral). Departamento de Urbanismo y Ordenación del Territorio. Universidad Politécnica de Madrid
[9] https://land.copernicus.eu/pan-european/corine-land-cover
[10] Sistema de Información Sobre Ocupación del Suelo en España. https://www.siose.es/
[11] Goal 23 (to define rational and sustainable land use patterns) and guidelines 6, 76, 85, 86, 89, 100, 101, and 102 of the Territorial Strategy of the Valencian Community (Decree 1/2011, of 13 January, of the Consell) associate the calculation of the maximum Land Occupation Index and other determinations with the data of the SIOSE Cartography
[12] Angel, S. (2015). The rise and fall of Manhattan’s densities, 1800-2010. Marron Institute of Urban Management. NYU. https://marroninstitute.nyu.edu/uploads/content/Manhattan_Densities_High_Res,_1_January_2015.pdf
[13] Some of these errors are relatively easy to detect when working with the database, as in the case of the cadastral plot 3159605DF3835G, located at Calle Cantabria, 41, in Barcelona; a verification in www.sedecatastro.gob.es allows you to download an Excel table with your real estate, which includes premises on floors up to 99, a height that no building in Spain reaches. but the cadastral cartography reflects 17 plants, a value verifiable photographically; Apparently, the plant data were filled in with the values of the construction unit number.
[14] Green, K, Congalton, R.G., Tukman, M (2017). Imagery and GIS : best practices for extracting information from imagery. Esri Press
[15] Mindehoud, P.S.J et alt (2019) « Mekong delta much lower than previously assumed in sea-level rise impact assessments. Nature Communications, 2019; 10:3847
[16] Barros Guerton, J.; Ezquiaga Domínguez, J.M. (2019, July 13). Los datos abiertos como herramienta de aproximación a los parámetros de la morfología urbana. Caso de estudio: densidades urbanas en la Comunidad de Madrid. Paper presented at the ISUF-H-2019 Congress, Guadalajara, Mexico Unpublished proceedings.
[17] https://www.comunidad.madrid/servicios/urbanismo-medio-ambiente/visor-sit-sistema-informacion-territorial
[18] In the particular case of this APE, unlike others, it has been possible to access general data through the portal but not part of the documents in the files
[19] The European commitment to energy efficiency already allows in some states such as France to have data on energy consumption by units similar to census tracts, differentiating between gas and electricity. View https://www.statistiques.developpement-durable.gouv.fr/donnees-locales-de-consommation-denergie


Leave a comment